E-mini ES 2019/03/20 #ES_F #emini #sp500 #spx

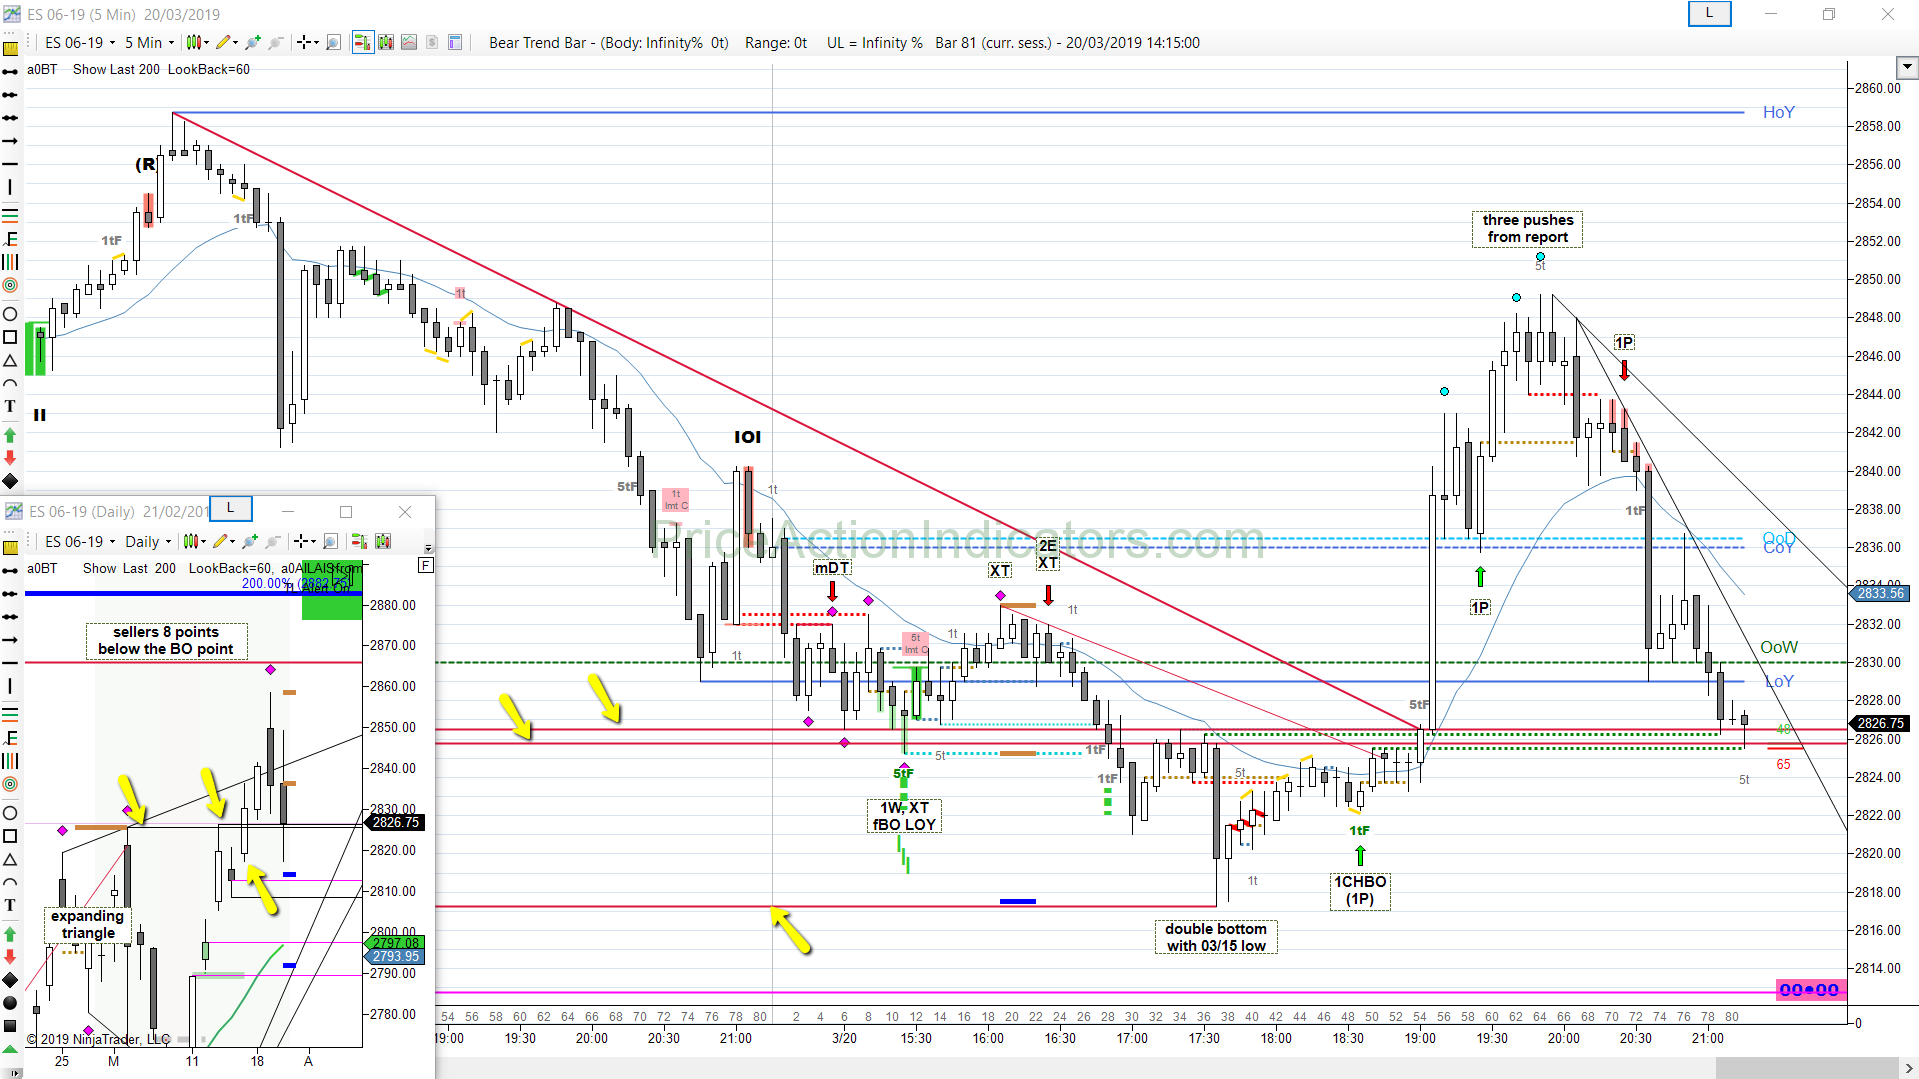
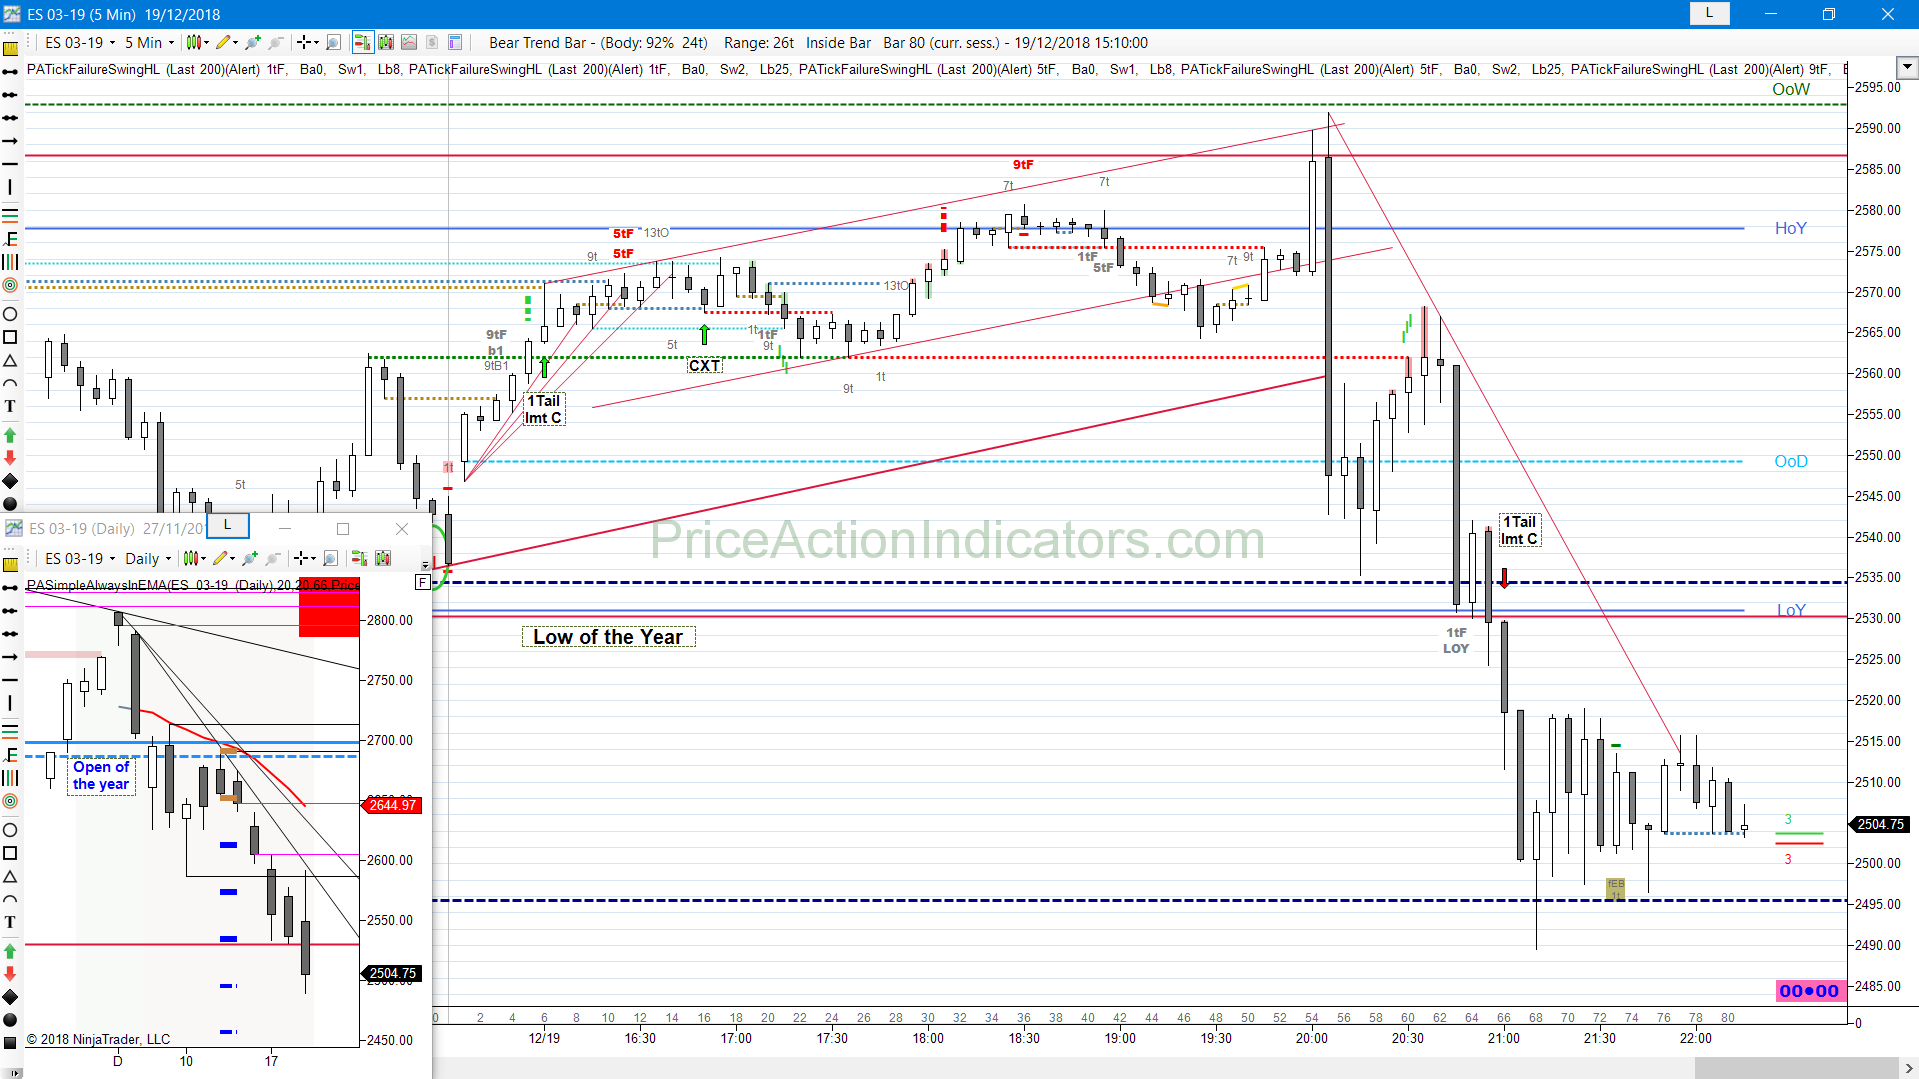
Continuation, mDT, 1W, XT, DB, 1CHBO, 1P
whipsaw at the LOY, then two pushes dn to a DB with 03/15, bull MC and BO during report, FOMC report
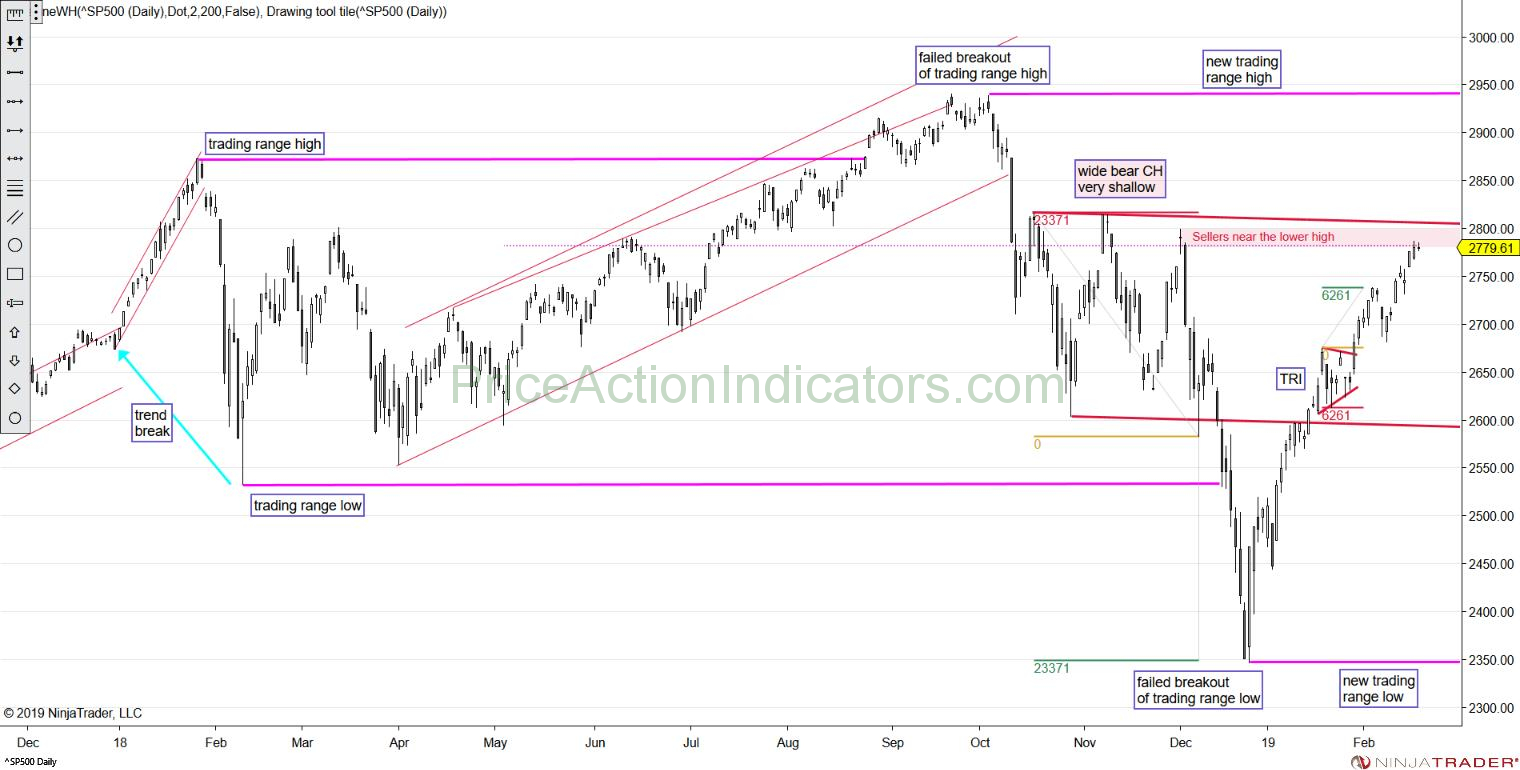
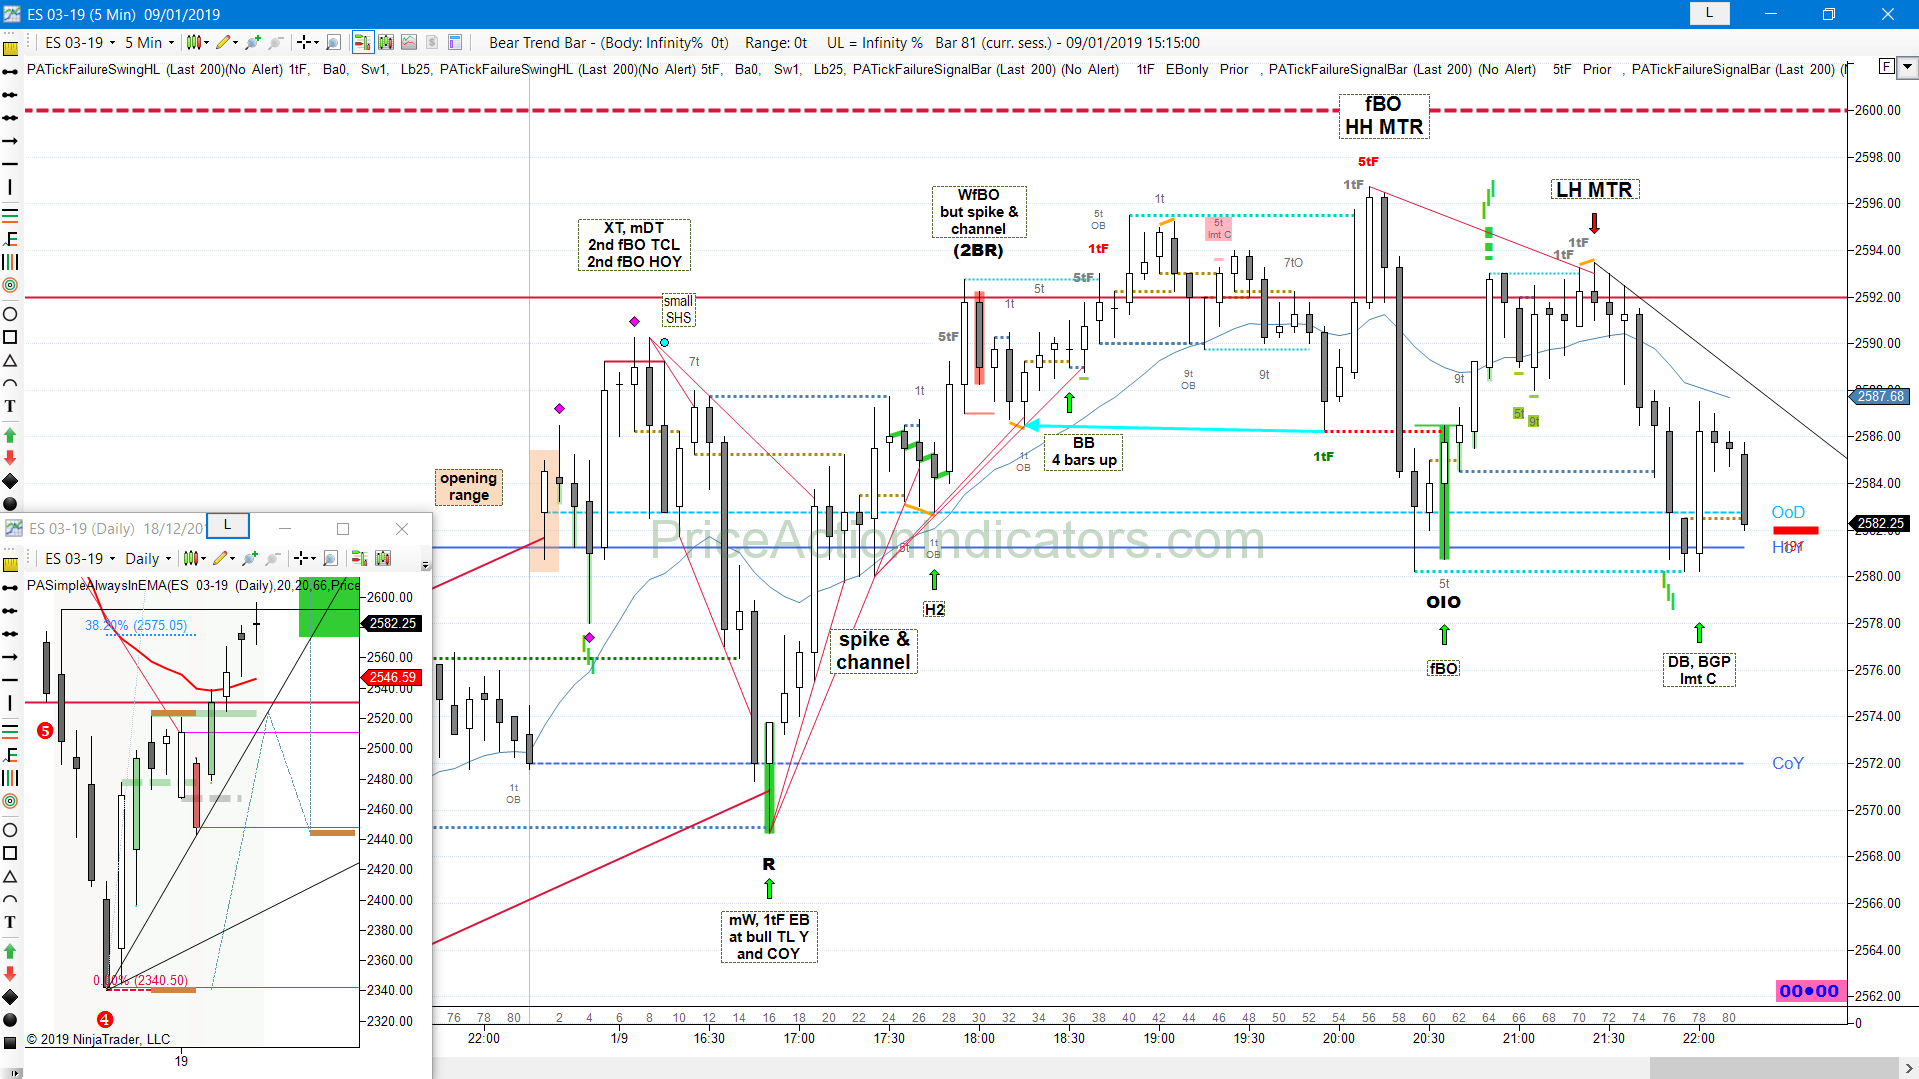
daily chart
Always In Long (AIL) since 03/12
bears shorted below yesterdays RVB and higher (around the open)
bulls managed to close above the last swing of the large XT and above that minor swing from last week


E-mini ES 2019/01/30

Bull gap, above HOY, bear MC, 1TL, mW, 1W, bull CH, fL2, 1tF BT, 1P, 1CHBO
FOMC report

daily chart
Always In Long (AIL) since 01/04
bulls BO above last weeks high and closed above, but Srs near the 12/12 swing high, which was a LH in the bear trend from last year
bears see DT with 12/12 LH

E-mini ES 2019/01/09

Bull gap, mid range, misplaced RVB, OR, XT, mDT, fBO HOY, SHS, mW, 1tF EB, SC, H2, BB, HH MTR, fBO, LH MTR, DB
FOMC report

daily chart
Always In Long (AIL) since 01/04
Sellers at the 12/19 lower high
bulls managed to close above HOY, not above the open though
forming a bear RVB

we met the target, I mentioned a couple of days ago

E-mini ES 2018/12/19

Continuation, 1Tail, CXT, bull CH
FOMC report

the largest FOMC bar ever 😉 49 points and a >100 pts sell off afterwards

bulls tried to fade the outside bar twice, but couldn’t close back ABOVE the BO point at 2562 (they were only able to close right at 2562)
so we got a 2nd leg dn

daily chart
Always In Short (AIS) since 12/06
five bars down, so sellers above HOY, scaling in higher
breakout test of the low of last week and the OOW, then a sell off, that went to 4 x IR of 12/12 signal bar, more profit taking by bears there

breakout and close below the L of the year, but an OB, which might attract faders, as well as possible buyers below the low of a large trading range