Continuation, fBO, bull MC, DT, DP, HL MTR, L2
E-mini S&P 500 Future 5 min chart (trend lines, arrows and boxed text drawn by hand)
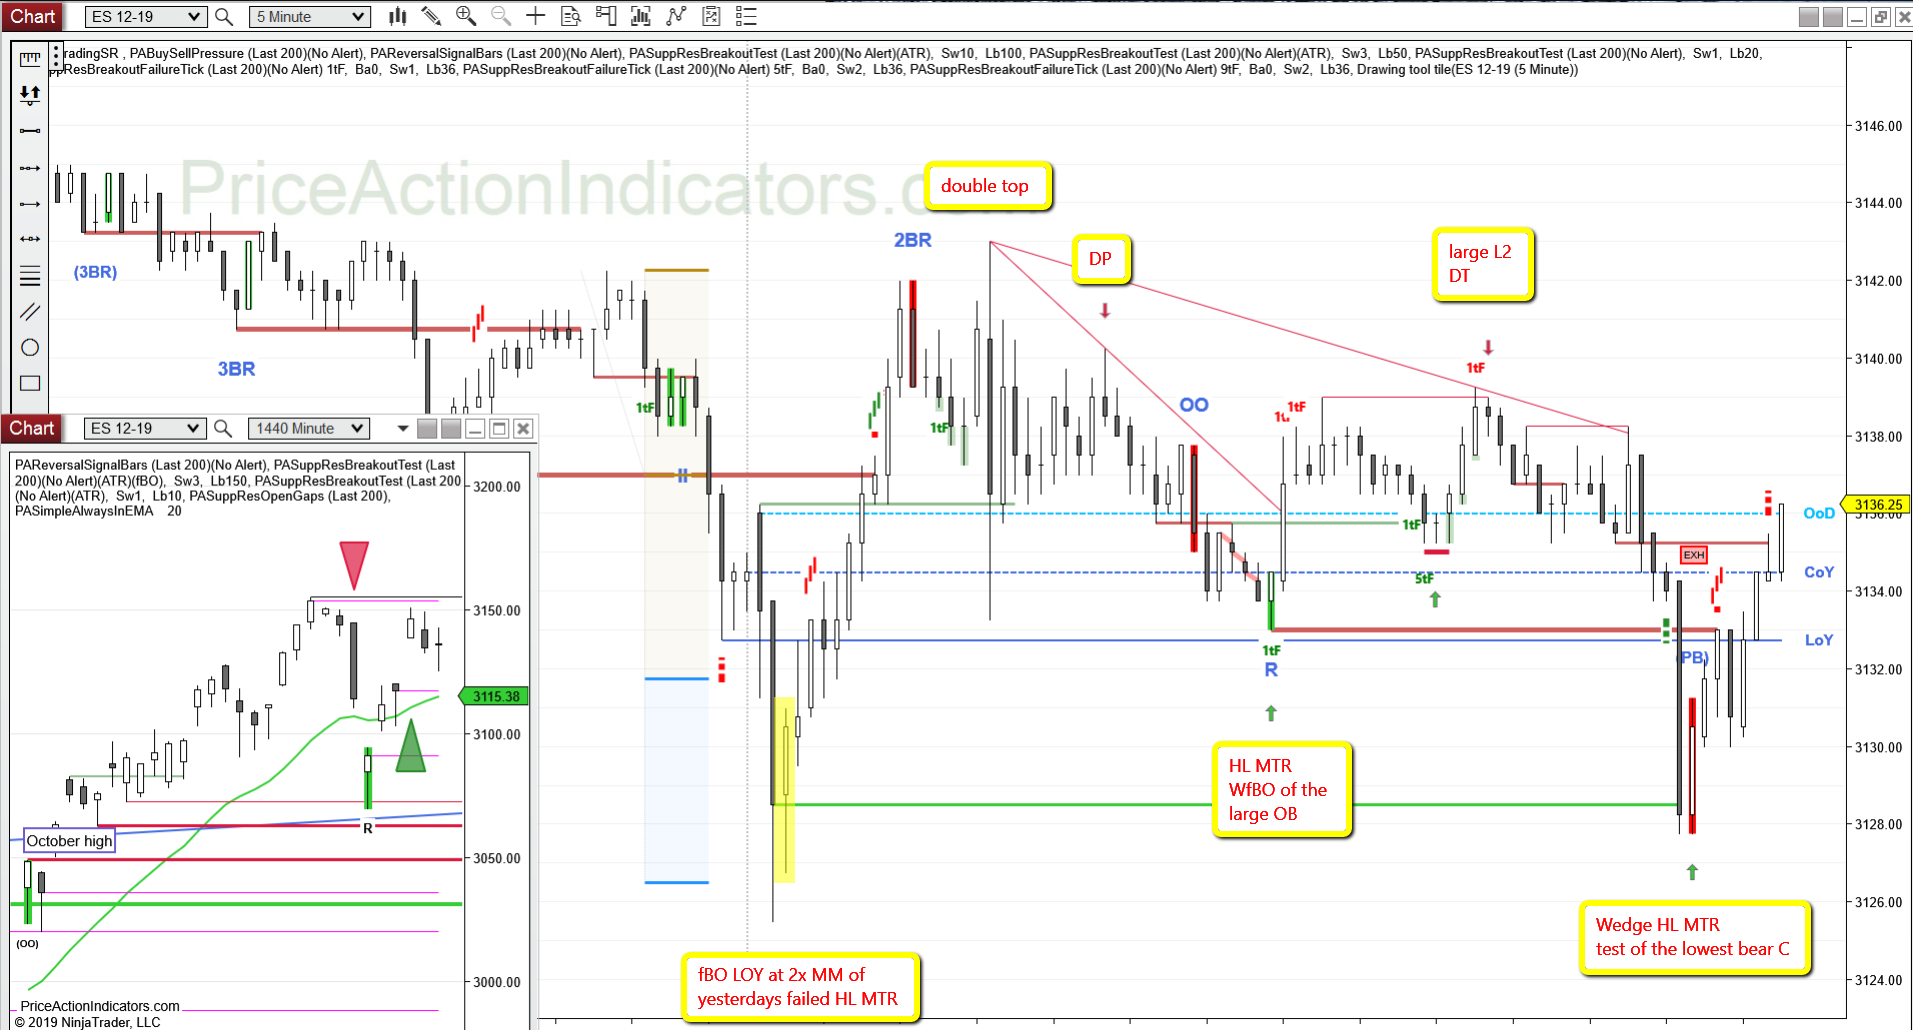
daily chart
Always In Long (AIL) since 12/06
weak EB for yesterday’s mDT

for NinjaTrader® – Forget Squiggly Lines!
Continuation, fBO, bull MC, DT, DP, HL MTR, L2
E-mini S&P 500 Future 5 min chart (trend lines, arrows and boxed text drawn by hand)
weak EB for yesterday’s mDT
Bull gap, above HOY, bull MC, 1P, BT, XT, mDB, SHS, L2, LH MTR
bull CH, bear CH and LH MTR on the re-test of the gap price (3150.25)
there was also nice Selling Pressure at that price (shrinking bull bodies in a bull move and a 5tF), the 2nd red circle
E-mini S&P 500 Future 5 min chart (trend lines, arrows and boxed text drawn by hand)
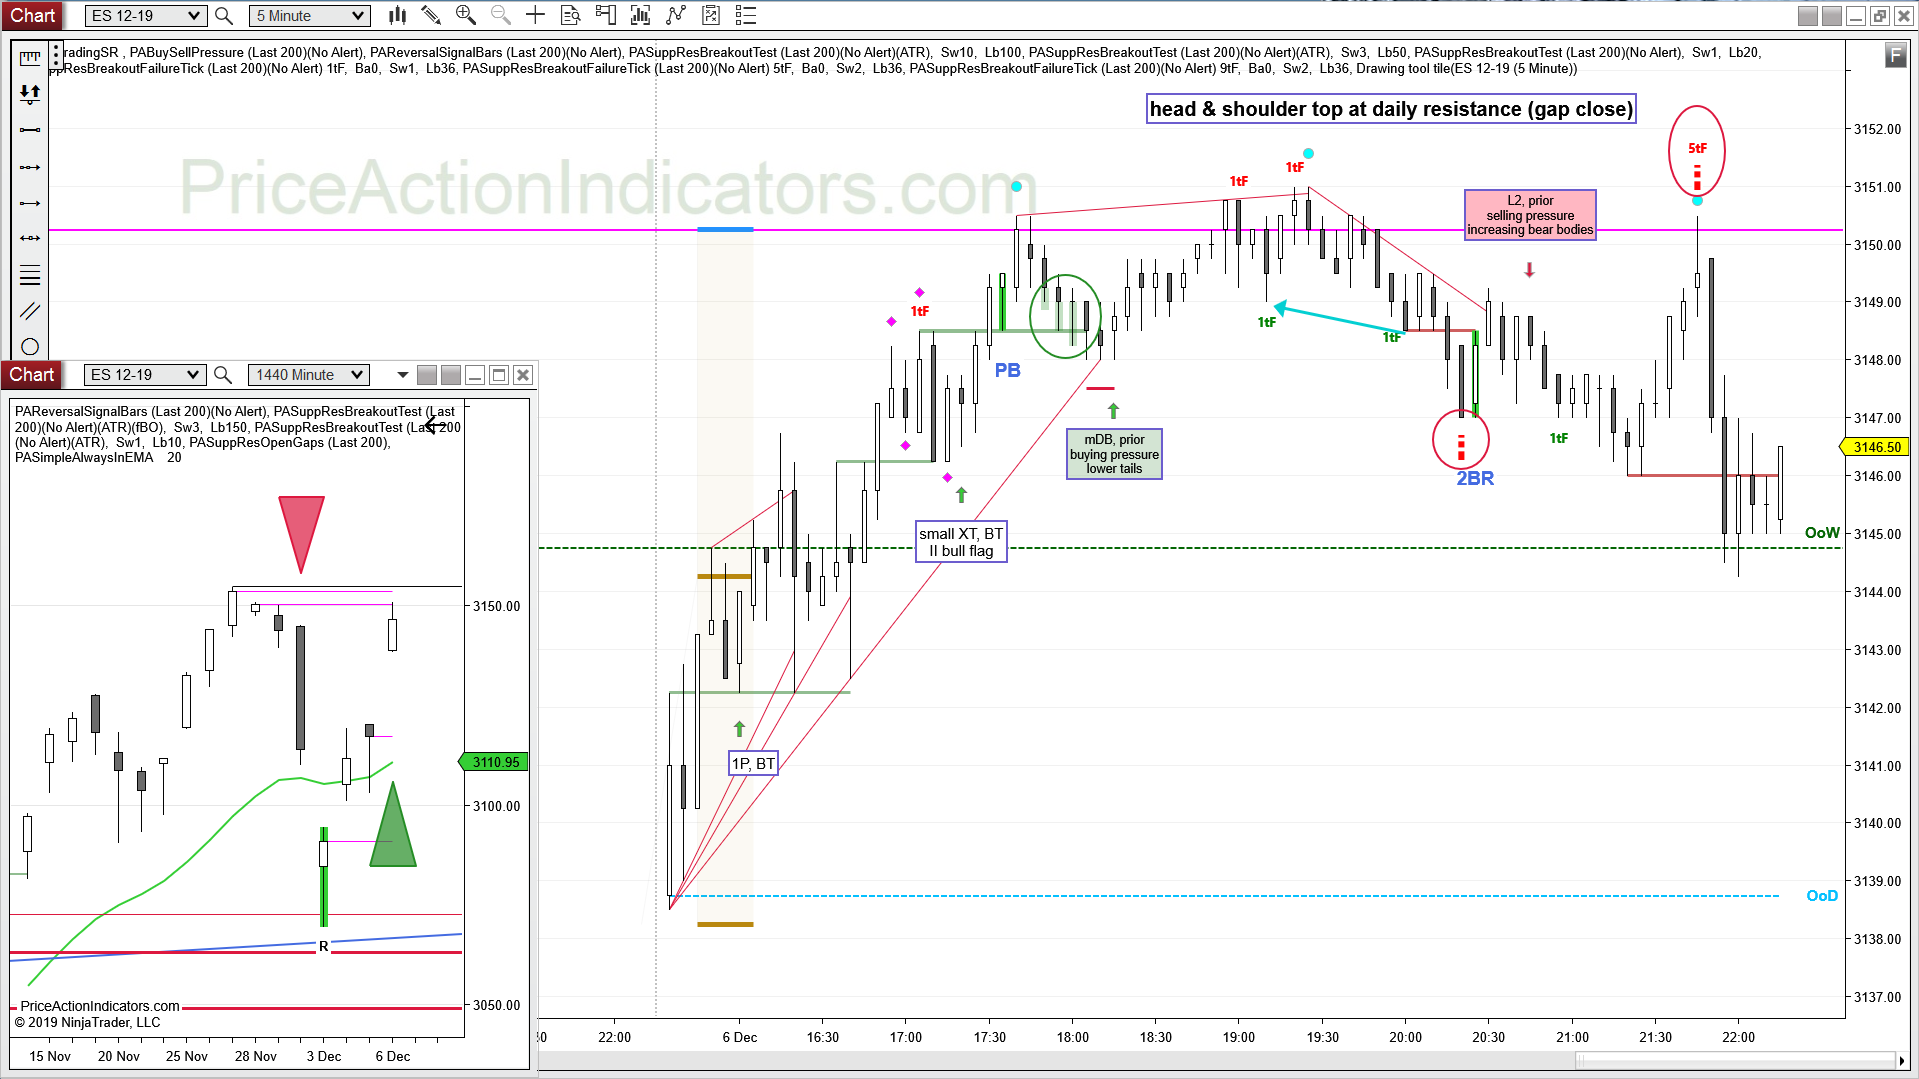
gap close, 2nd push up from Tuesday’s RVB
Continuation, mDB, bear MC, L2, 1CHBO, FF, fBO, bull MC, DB, HL MTR, fL2, bull CH
despite the good buying pressure (shrinking bear bodies with increasing lower tails) at the LOD, the move off of the DB HL MTR was only a weak bull CH and didn’t make it to the target, which would have been the high of the bull MC (the prominent LH)
E-mini S&P 500 Future 5 min chart (trend lines, arrows and boxed text drawn by hand)
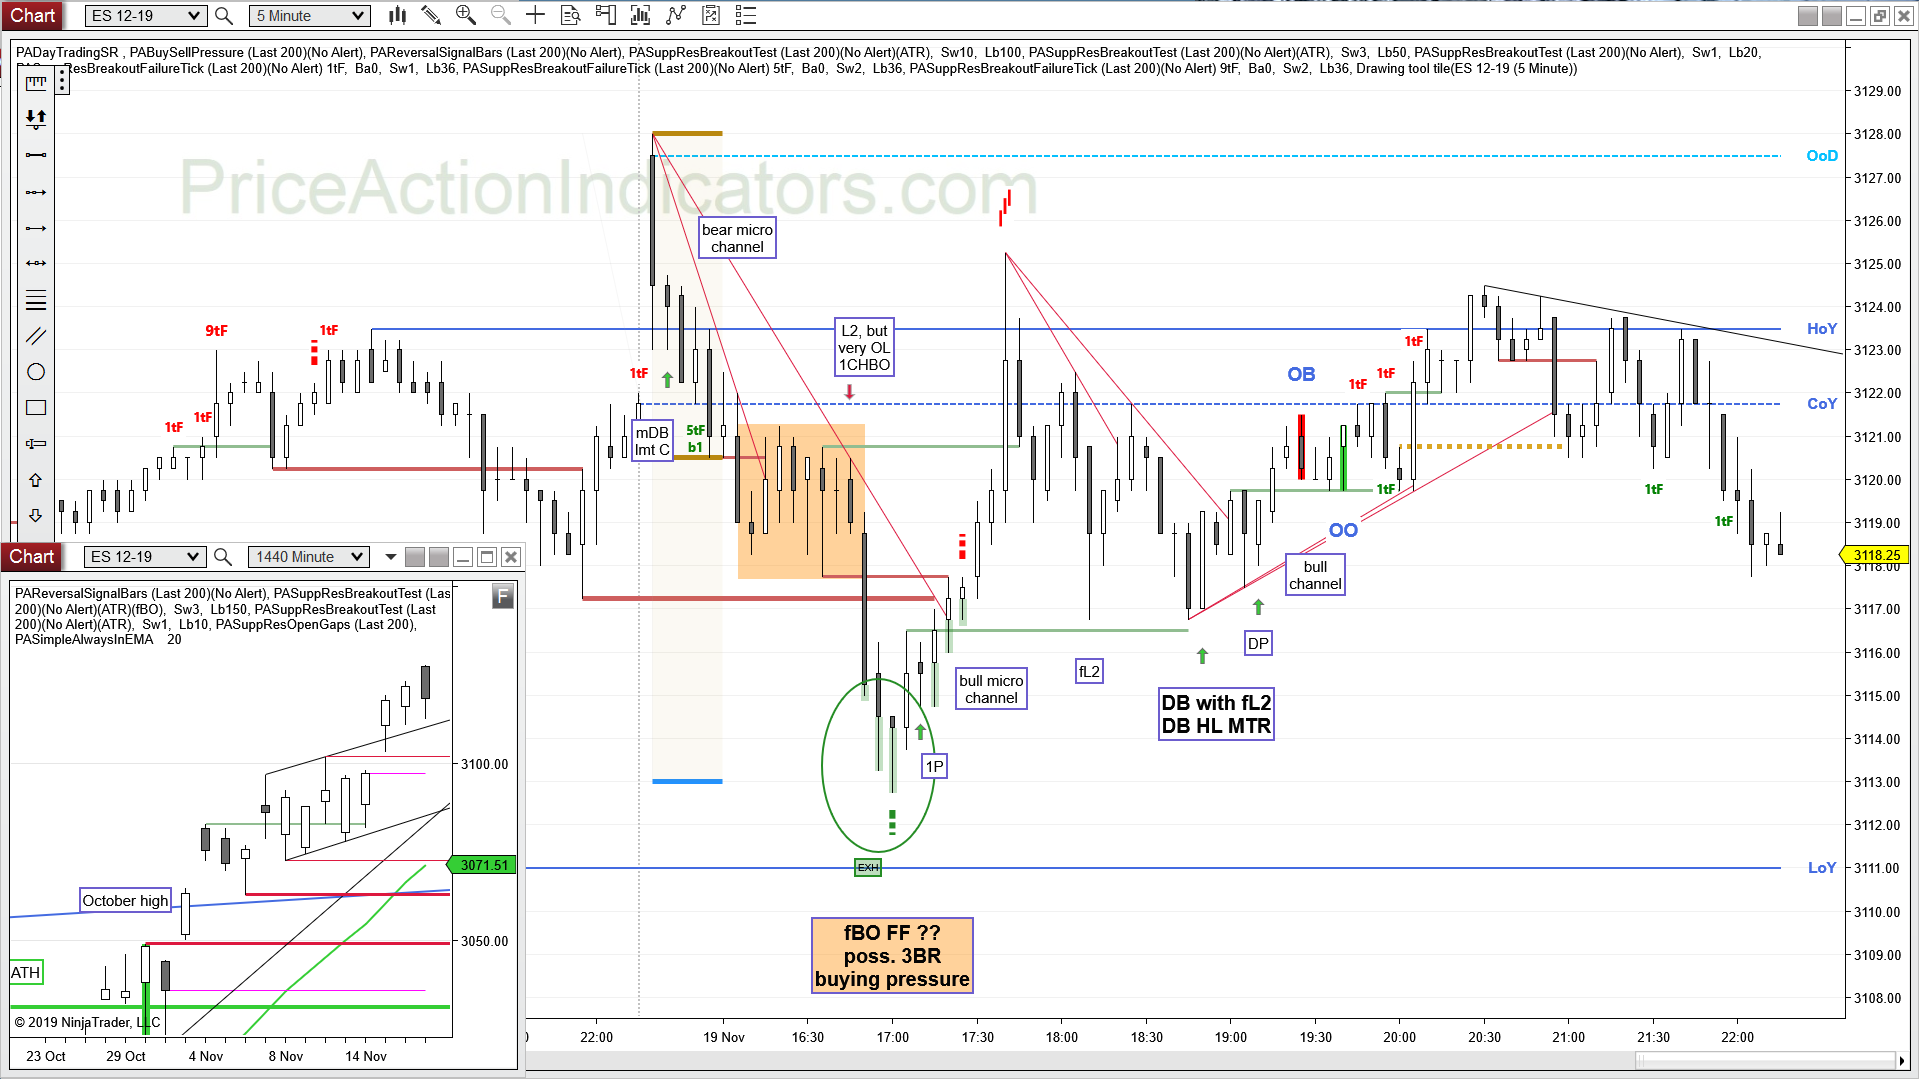
1st bear close after seven bull bodies, not a short yet
we’re still “Always In Long” on the daily chart
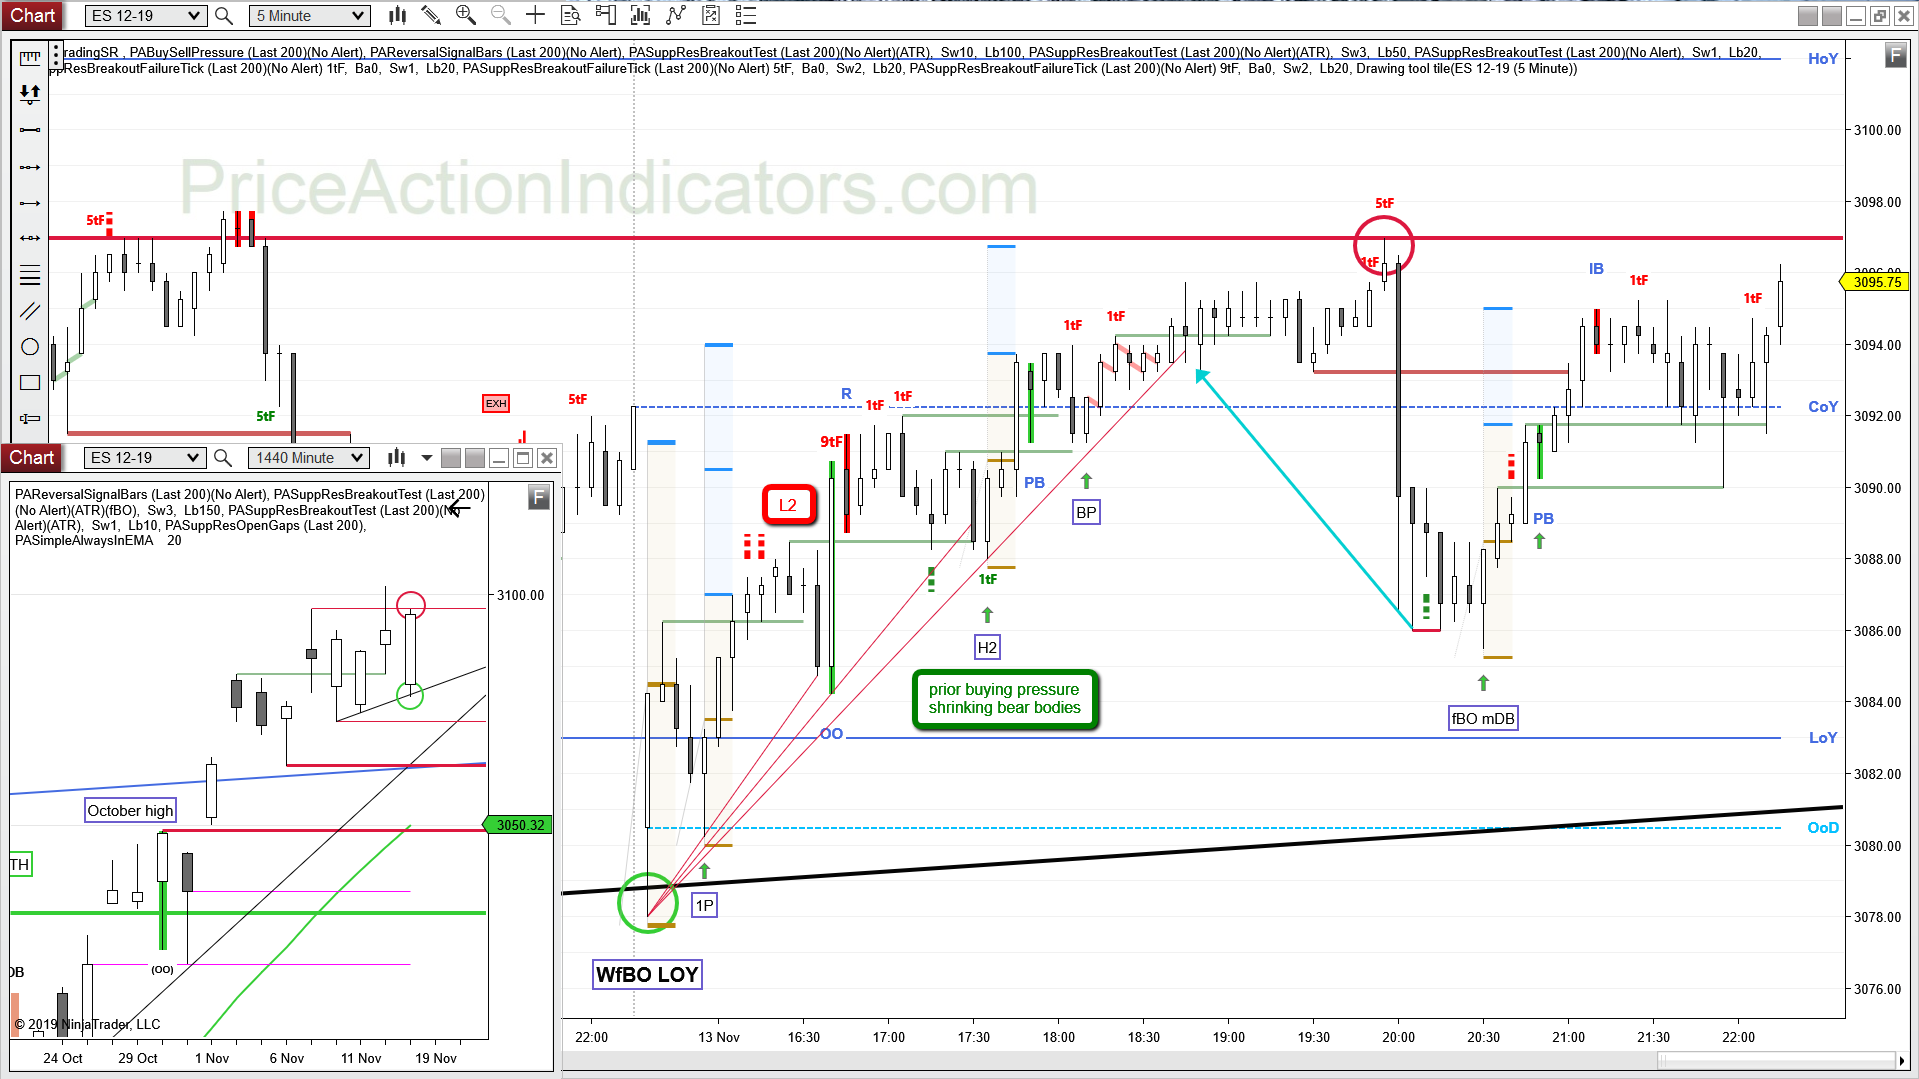
Bear gap, mid range, WfBO, 1P, L2, H2, BP, fBO, mDB
The 1st bar of the day is a large RVB, but the large body (60%) gives it a taste of a large trend bar or TR/CX as well. The risk to buy on a SE above was also more than 6 points. It’s better to wait for a 2E, which came with the 1P a couple of bars later (it was also a test of the OOD).
I didn’t take the L2 short on b11 (despite the shrinking bodies – selling pressure), as I expected the market to go at least to COY. Also after a WfBO LOY I expect a fL2 and at least two pushes up from a decent 1P.
The large OO (the fL2) trapped a lot of bears, which probably tried to scale-in above the L2. We formed a bear RVB after the OO (a poss. L3 and DT with yesterday’s last swing), but that didn’t trigger short, instead it triggered long 1st, which makes it a small TR (SA and BB). More up to COY (magnet).
I also marked up a couple of bull signal bars and the targets based on the initial risk for a possible SE and a bar stop below.
E-mini S&P 500 Future 5 min chart (trend lines, arrows and boxed text drawn by hand)
daily chart
Always In Long (AIL) since 10/10
another test of 3100 and another H1 buy
some bears might see a head & shoulder top with the high of last week
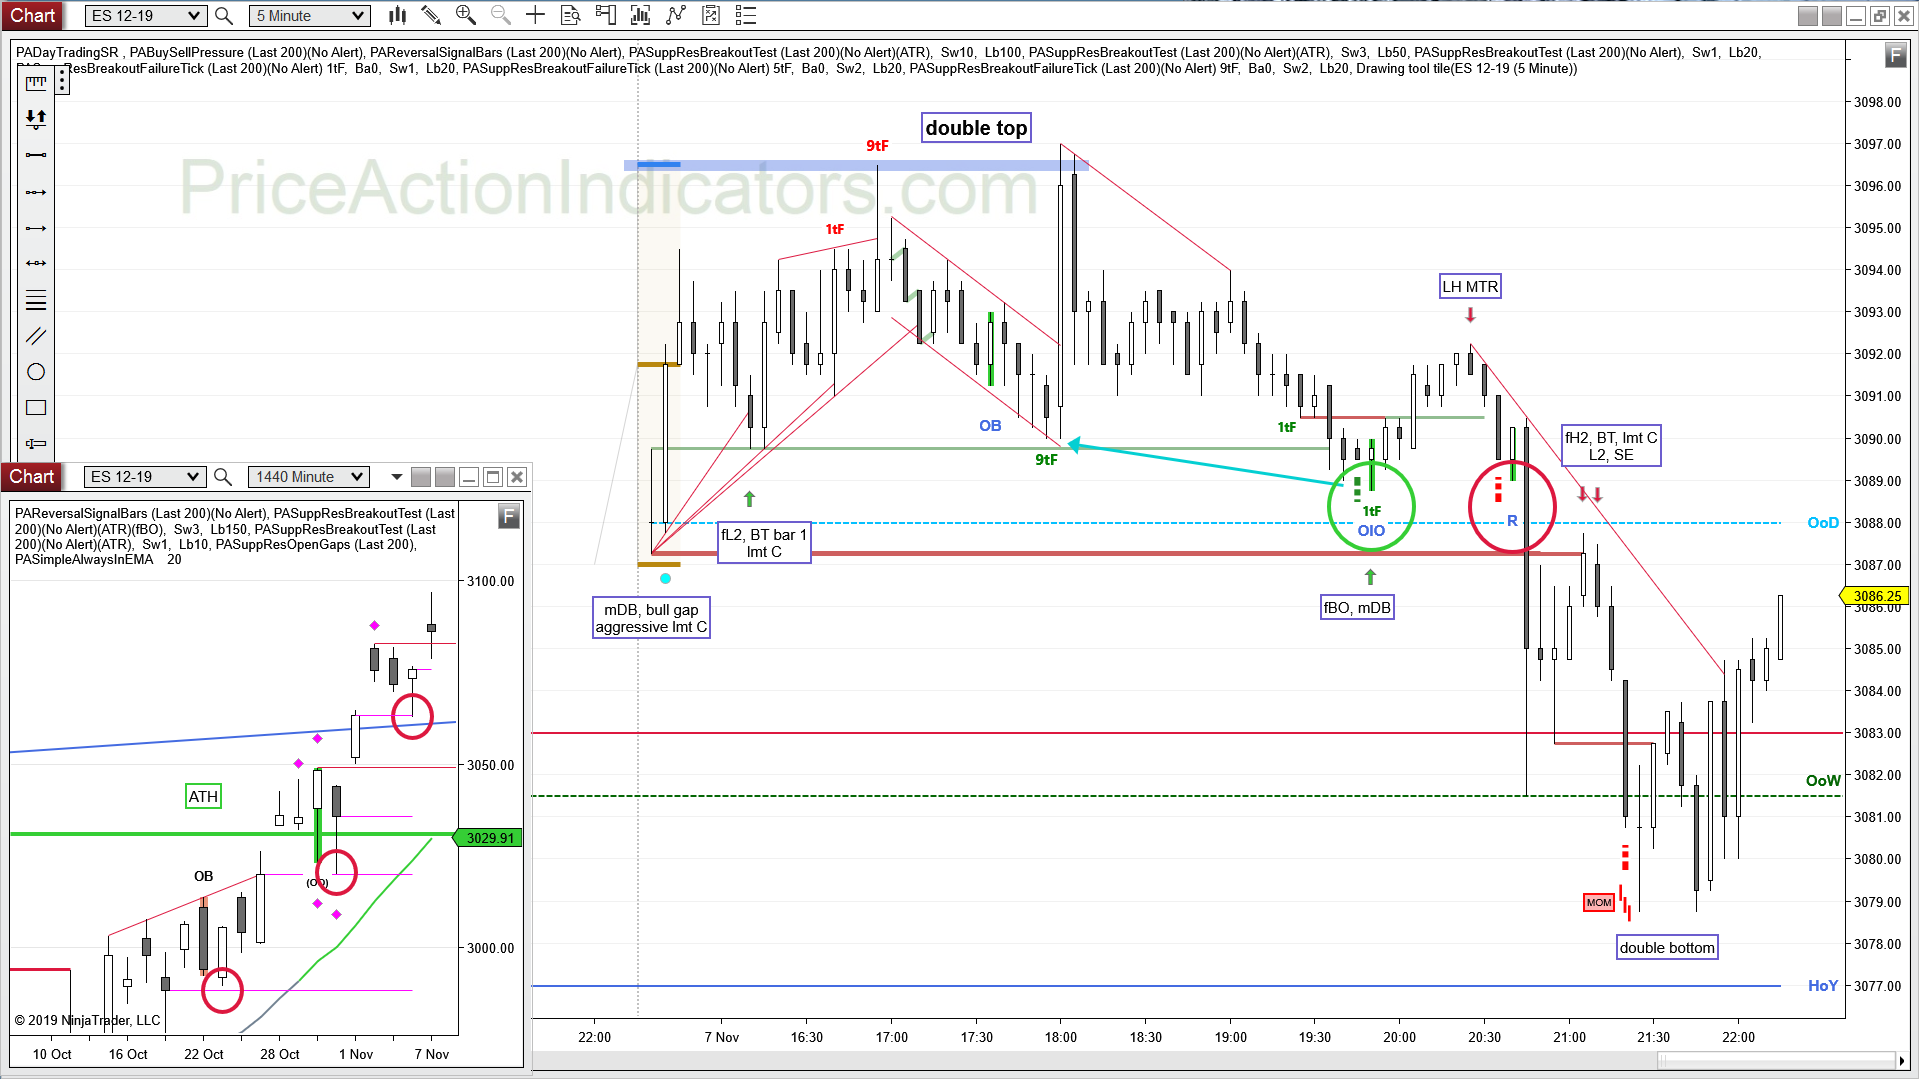
Bull gap, above HOY, mDB, fL2, DT, fBO, LH MTR, fH2, L2
Trading Range day with a late bear BO
Buying Pressure just before a buy Signal Bar (green circle) and Selling Pressure just before a buy Signal Bar (red circle – a hint to wait for a 2E).
E-mini S&P 500 Future 5 min chart (trend lines, arrows and boxed text drawn by hand)
daily chart
Always In Long (AIL) since 10/10
a weak Reversal Signal Bar for the bears