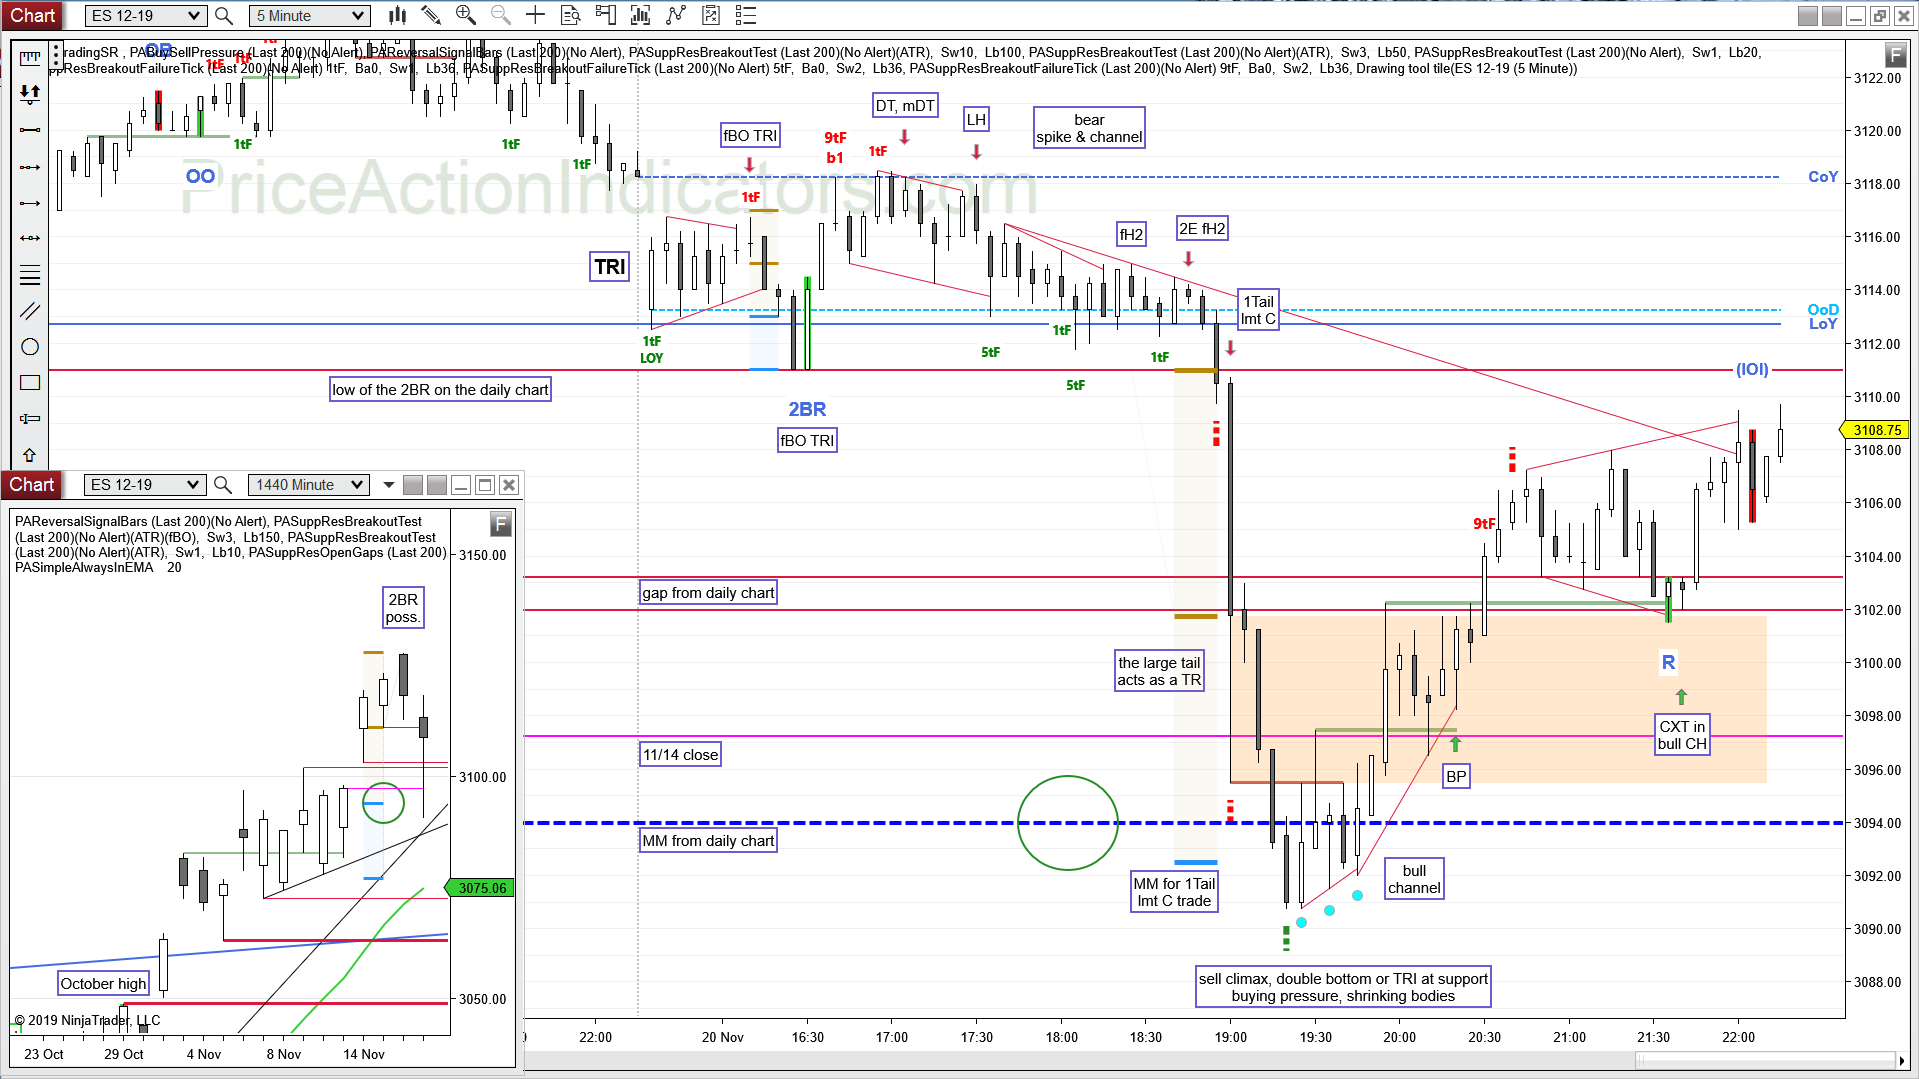
Continuation, DT, mDT, 1W, DB, bull MC, CXT
small TR day
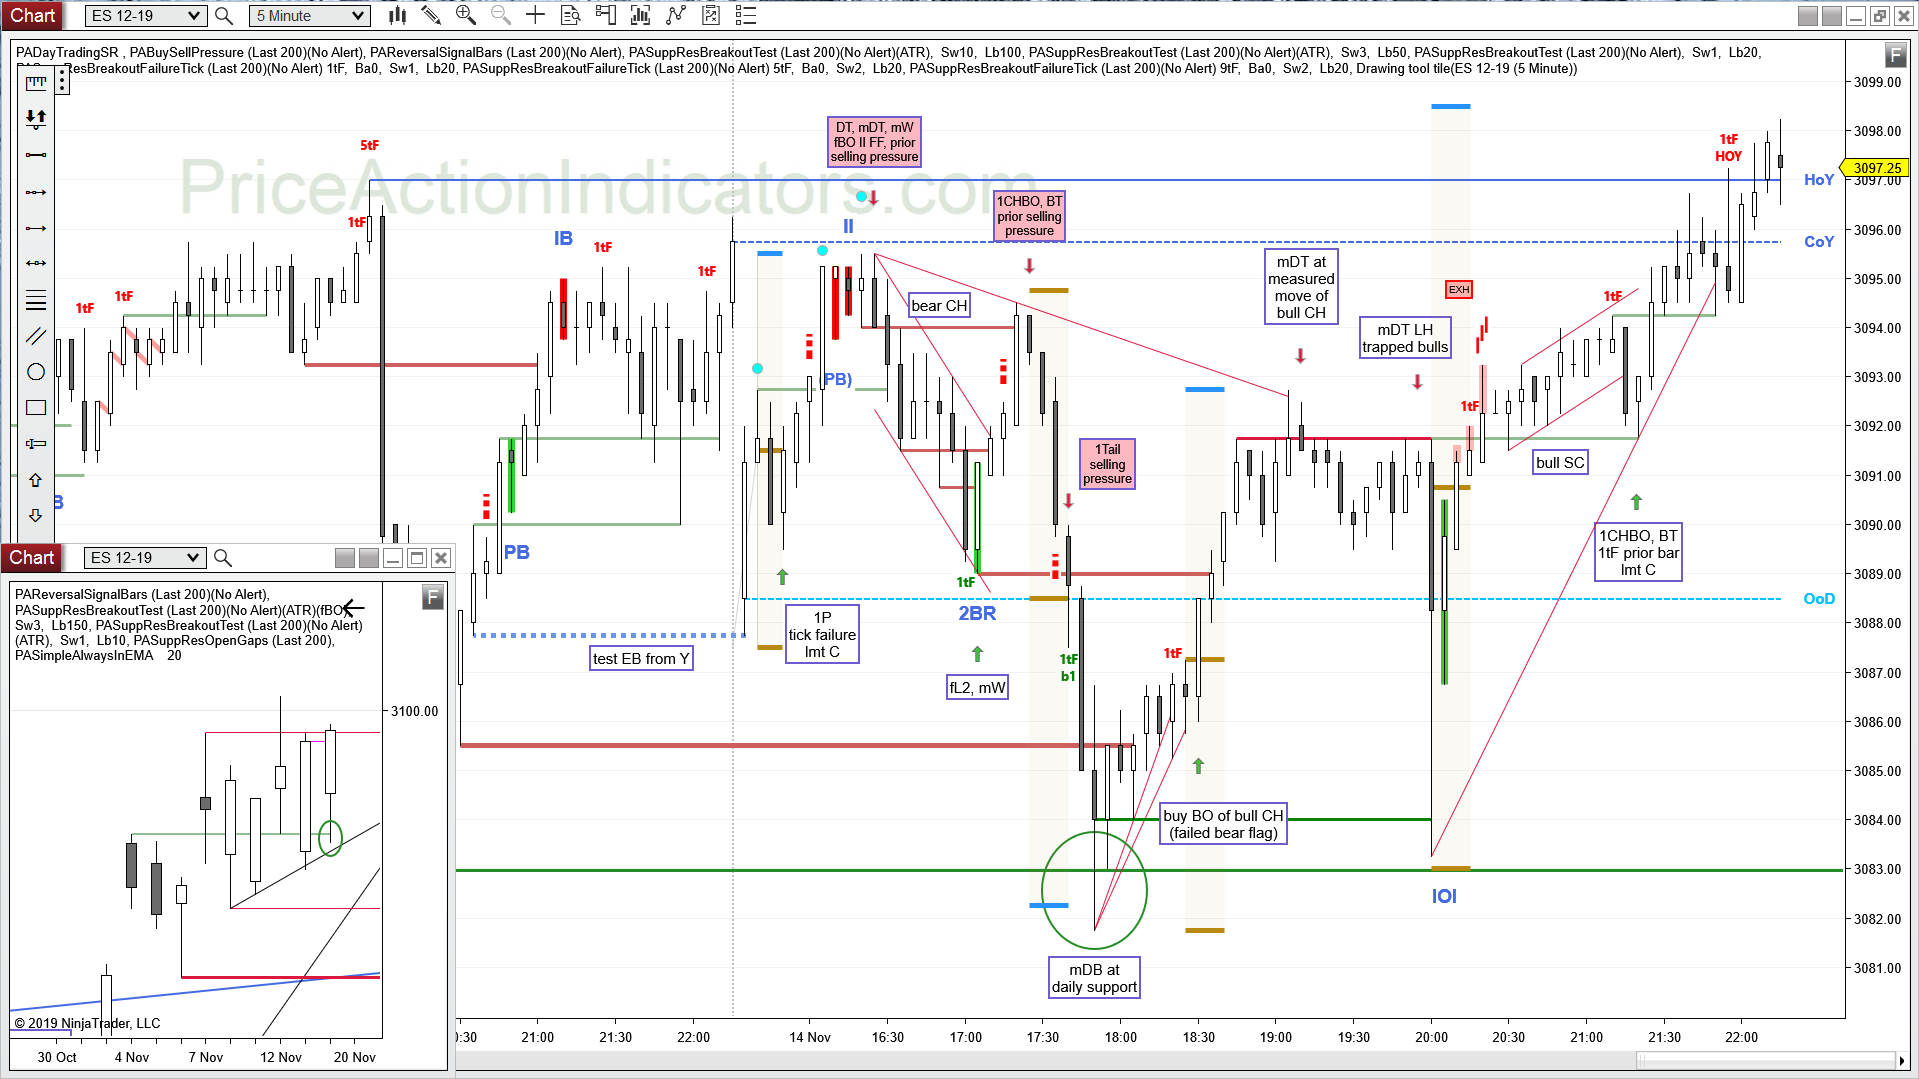
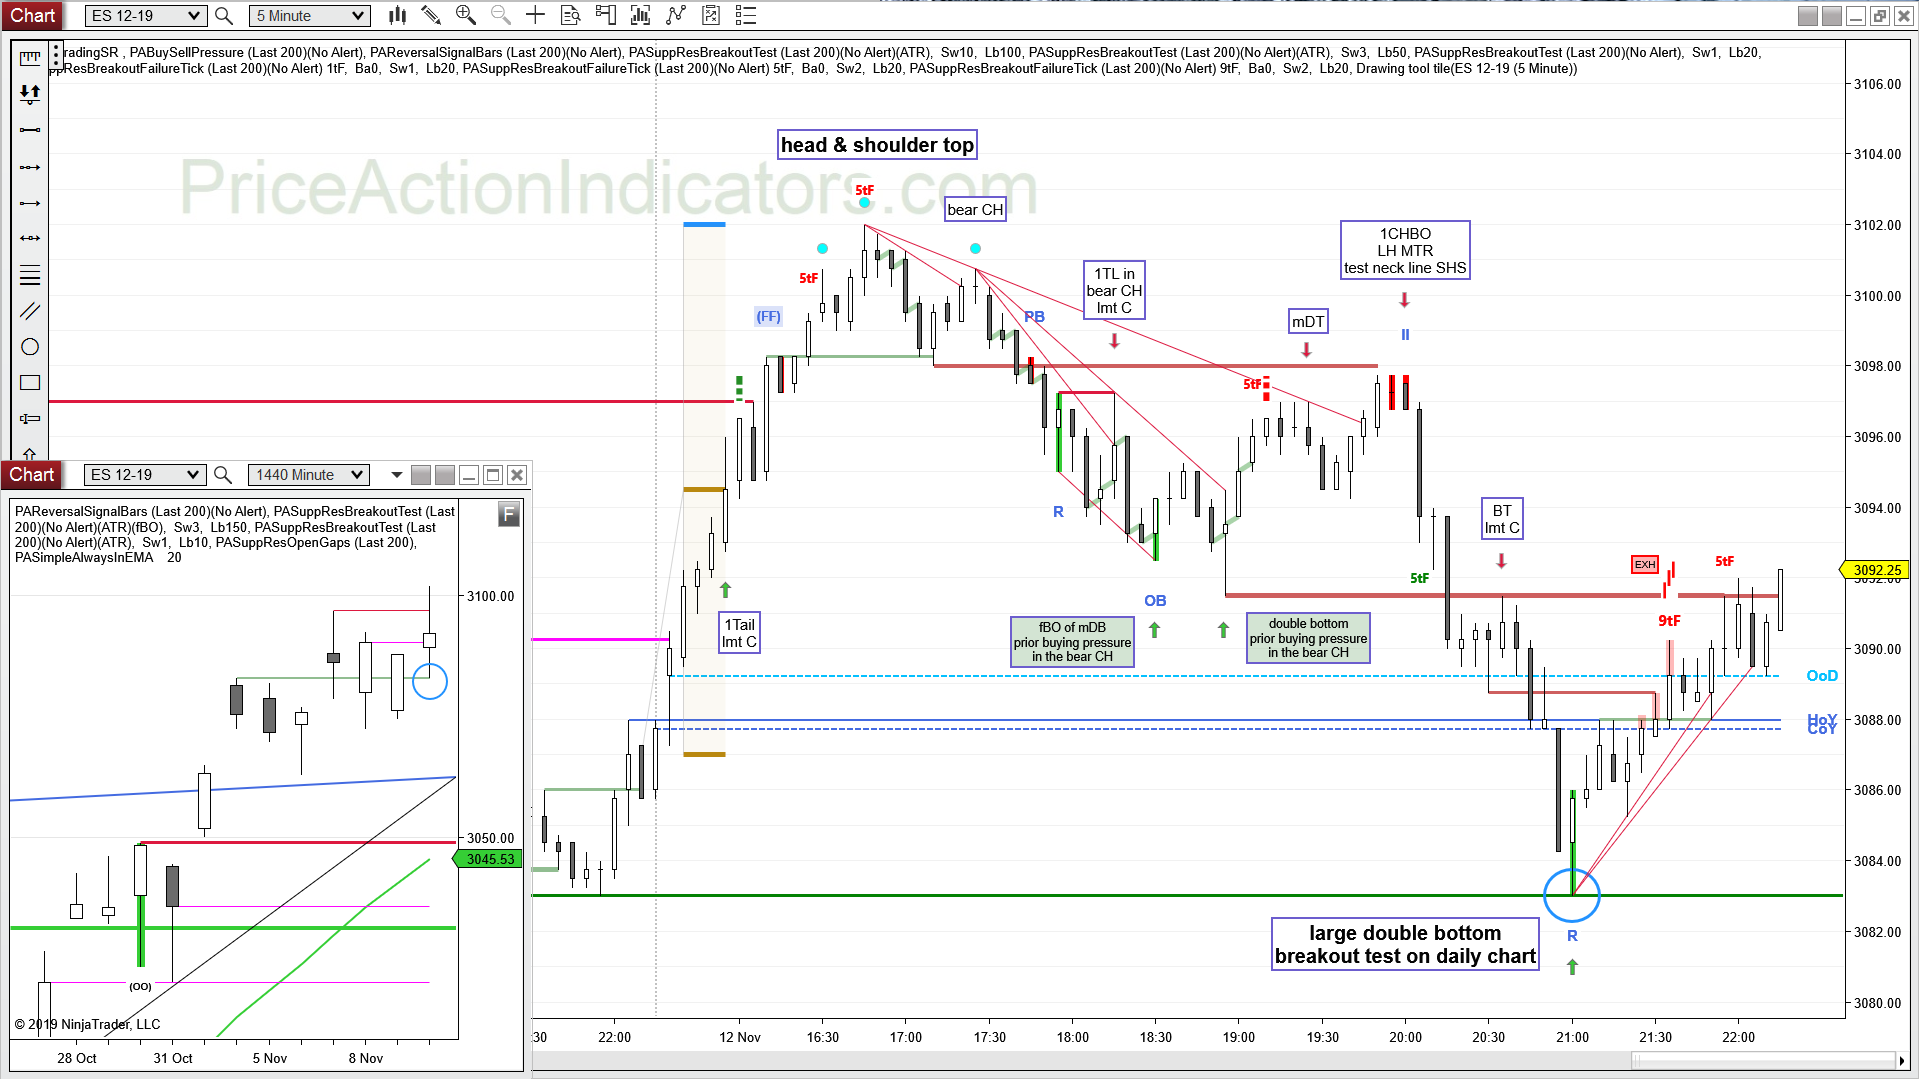
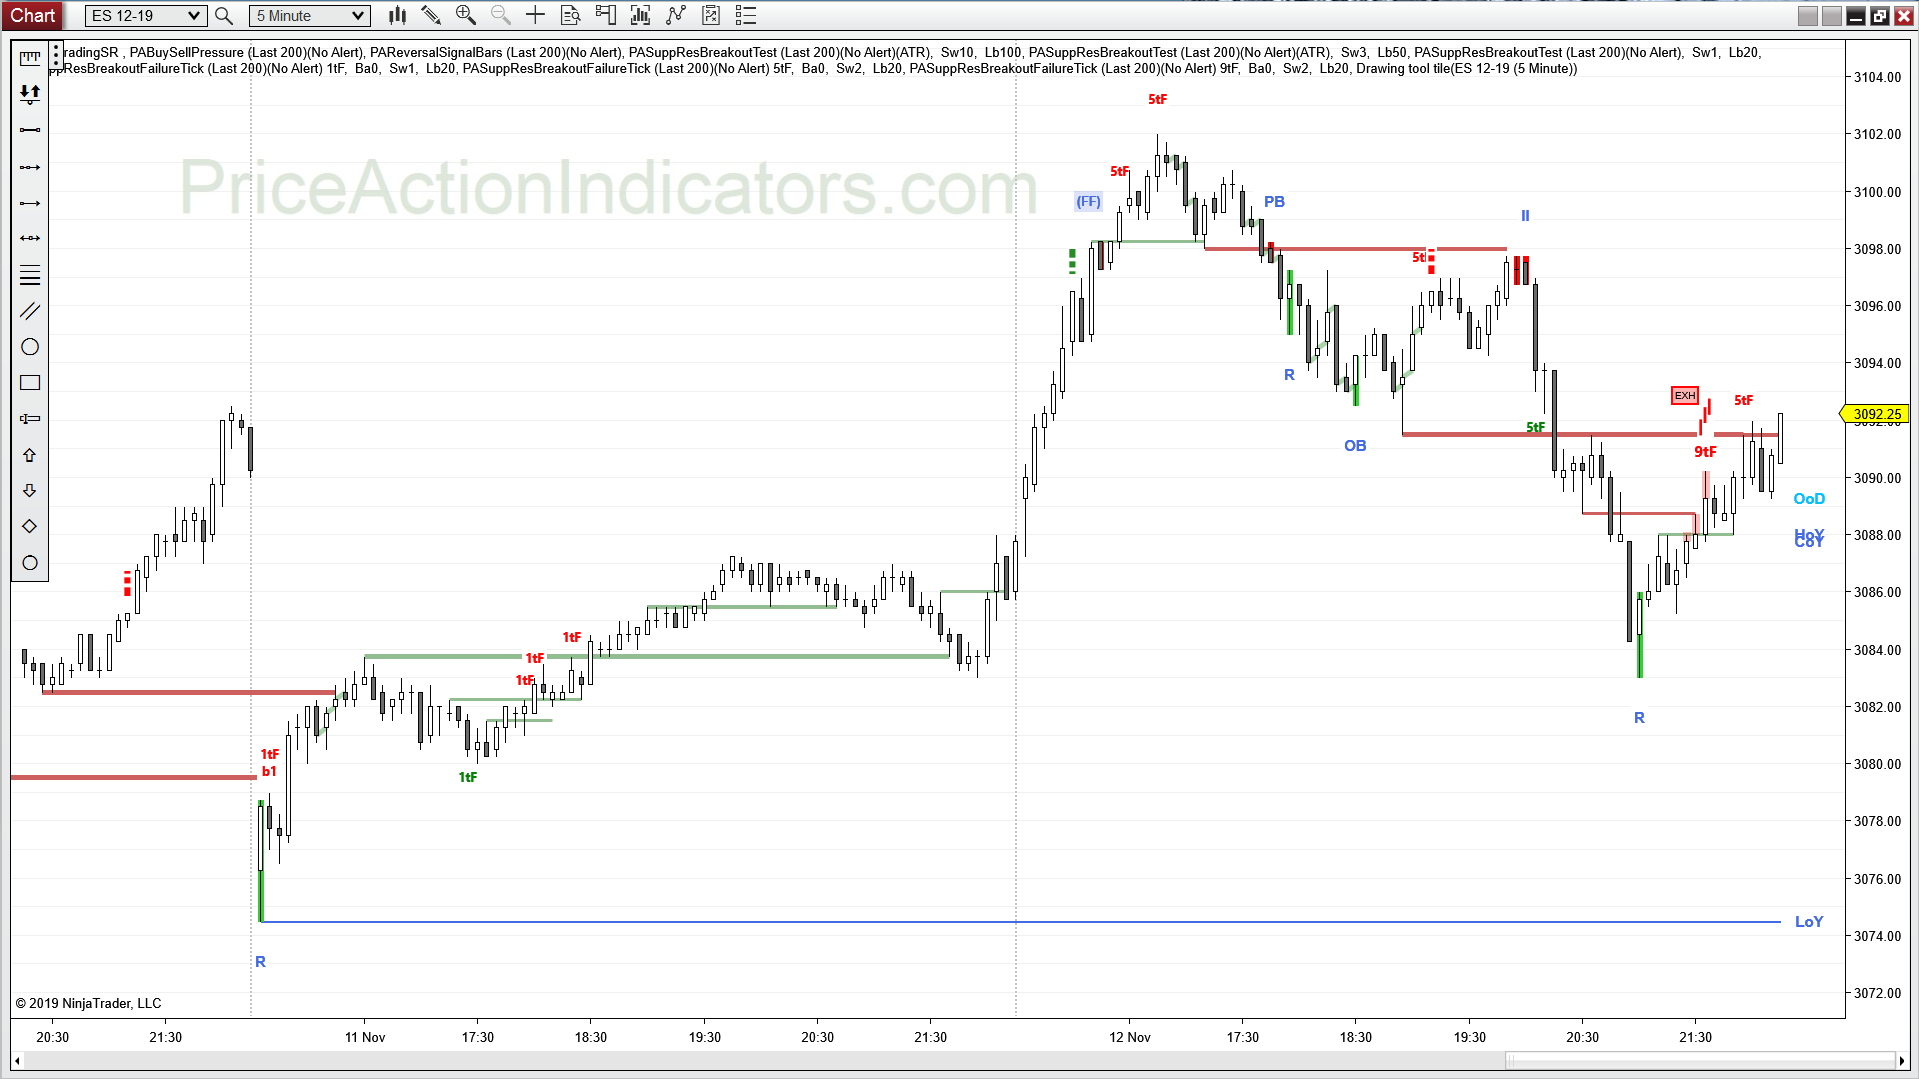
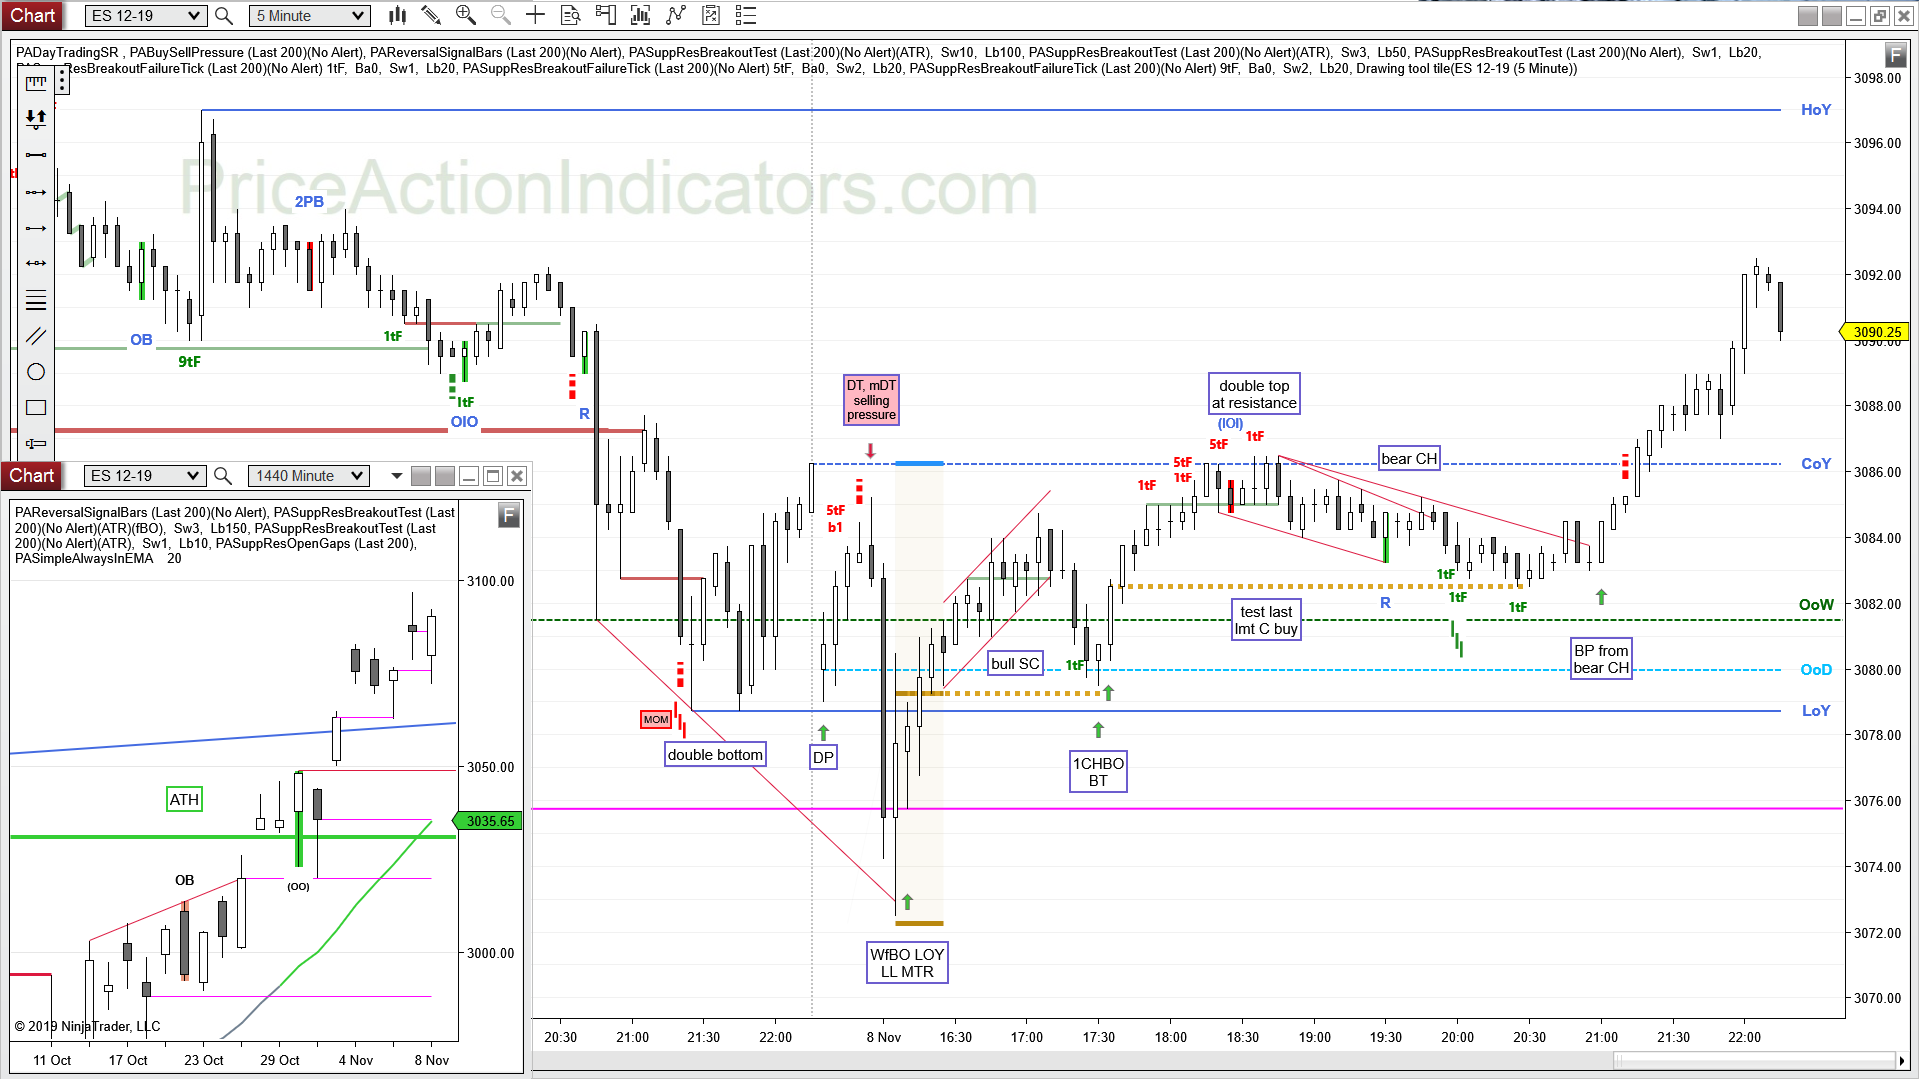
E-mini S&P 500 Future 5 min chart (trend lines, arrows and boxed text drawn by hand)
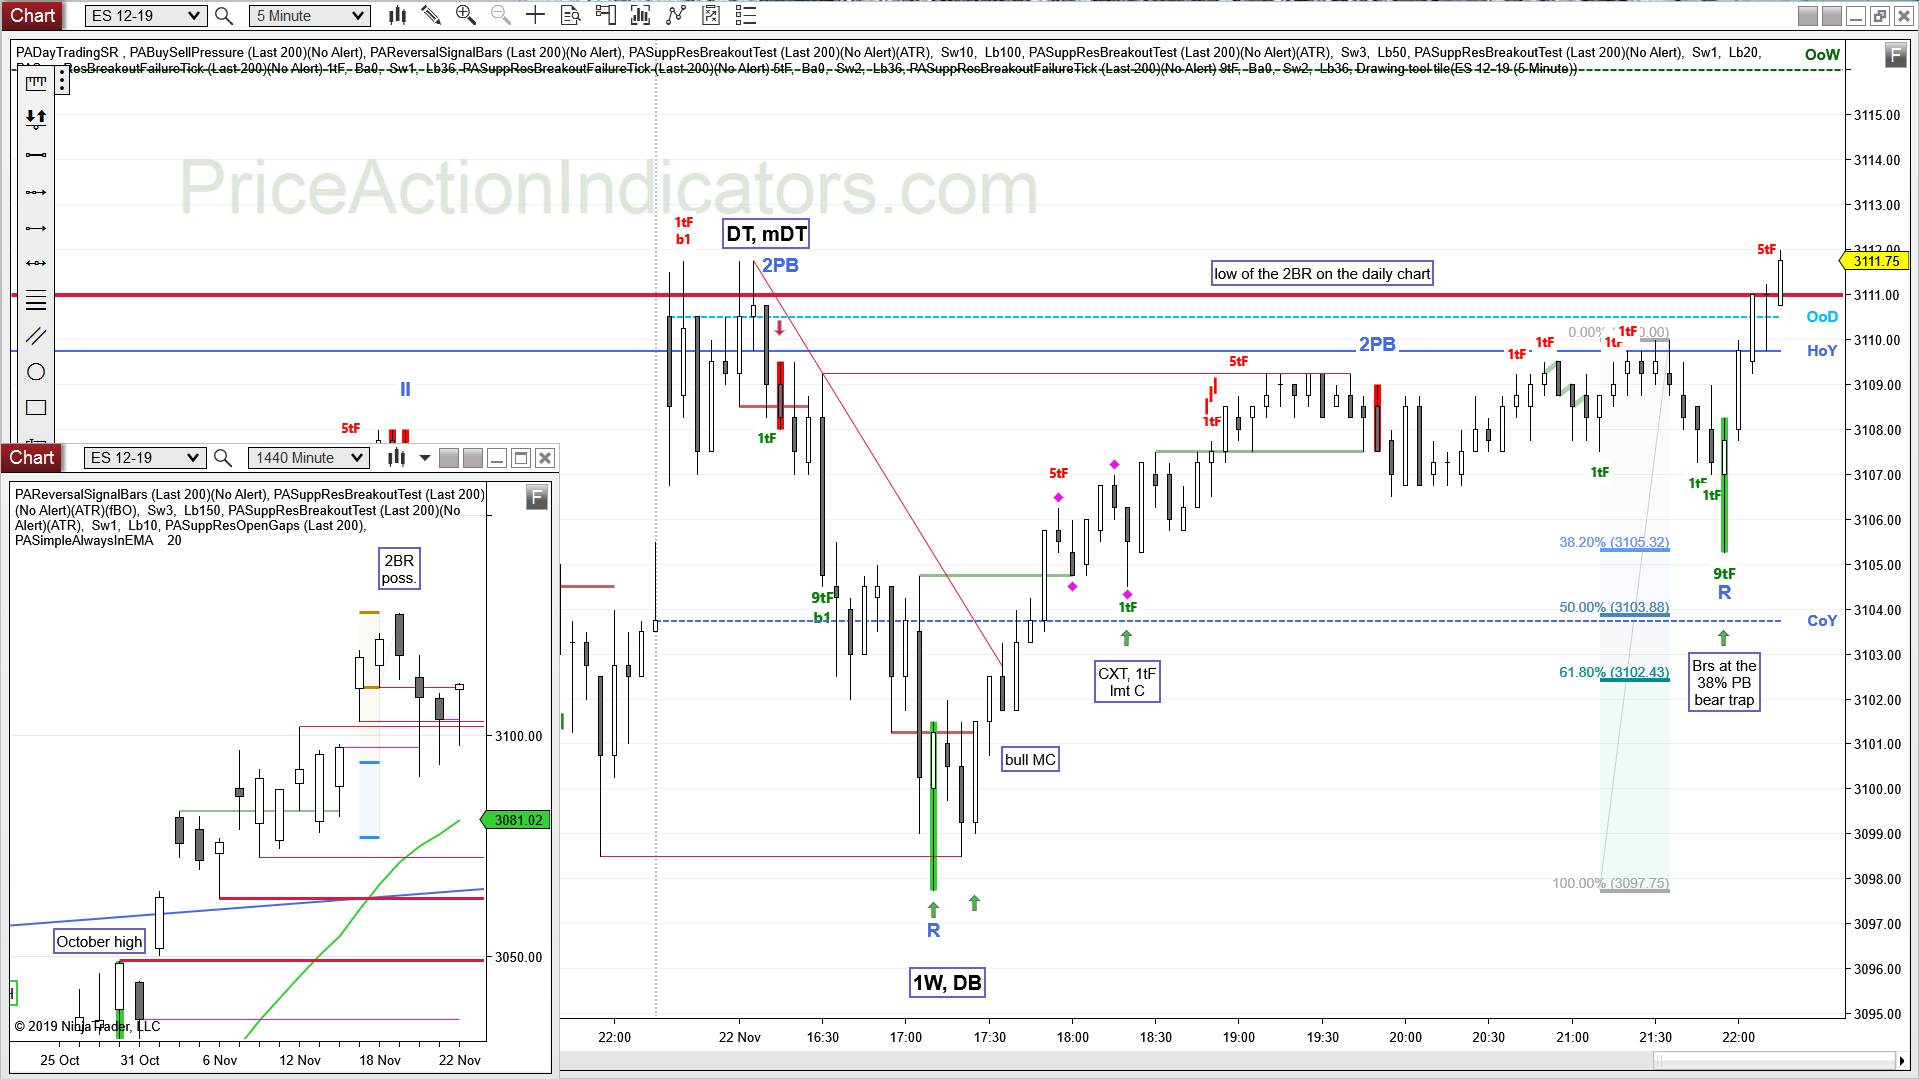
daily chart
Always In Long (AIL) since 10/10 – now over one month !!
technically (by a whisker) no failed Entry Bar (for yesterday’s H1 buy SB)
bulls managed to close above the HOY and have a small bull body
they could even close above the low of the 2BR