Bull gap, mid range, T1B, 1P, SC, BT, mW, PW
E-mini S&P 500 Future 5 min chart (trend lines, arrows and boxed text drawn by hand)
daily chart
Always In Short (AIS) since 02/24
Follow through for yesterday’s breakout bar
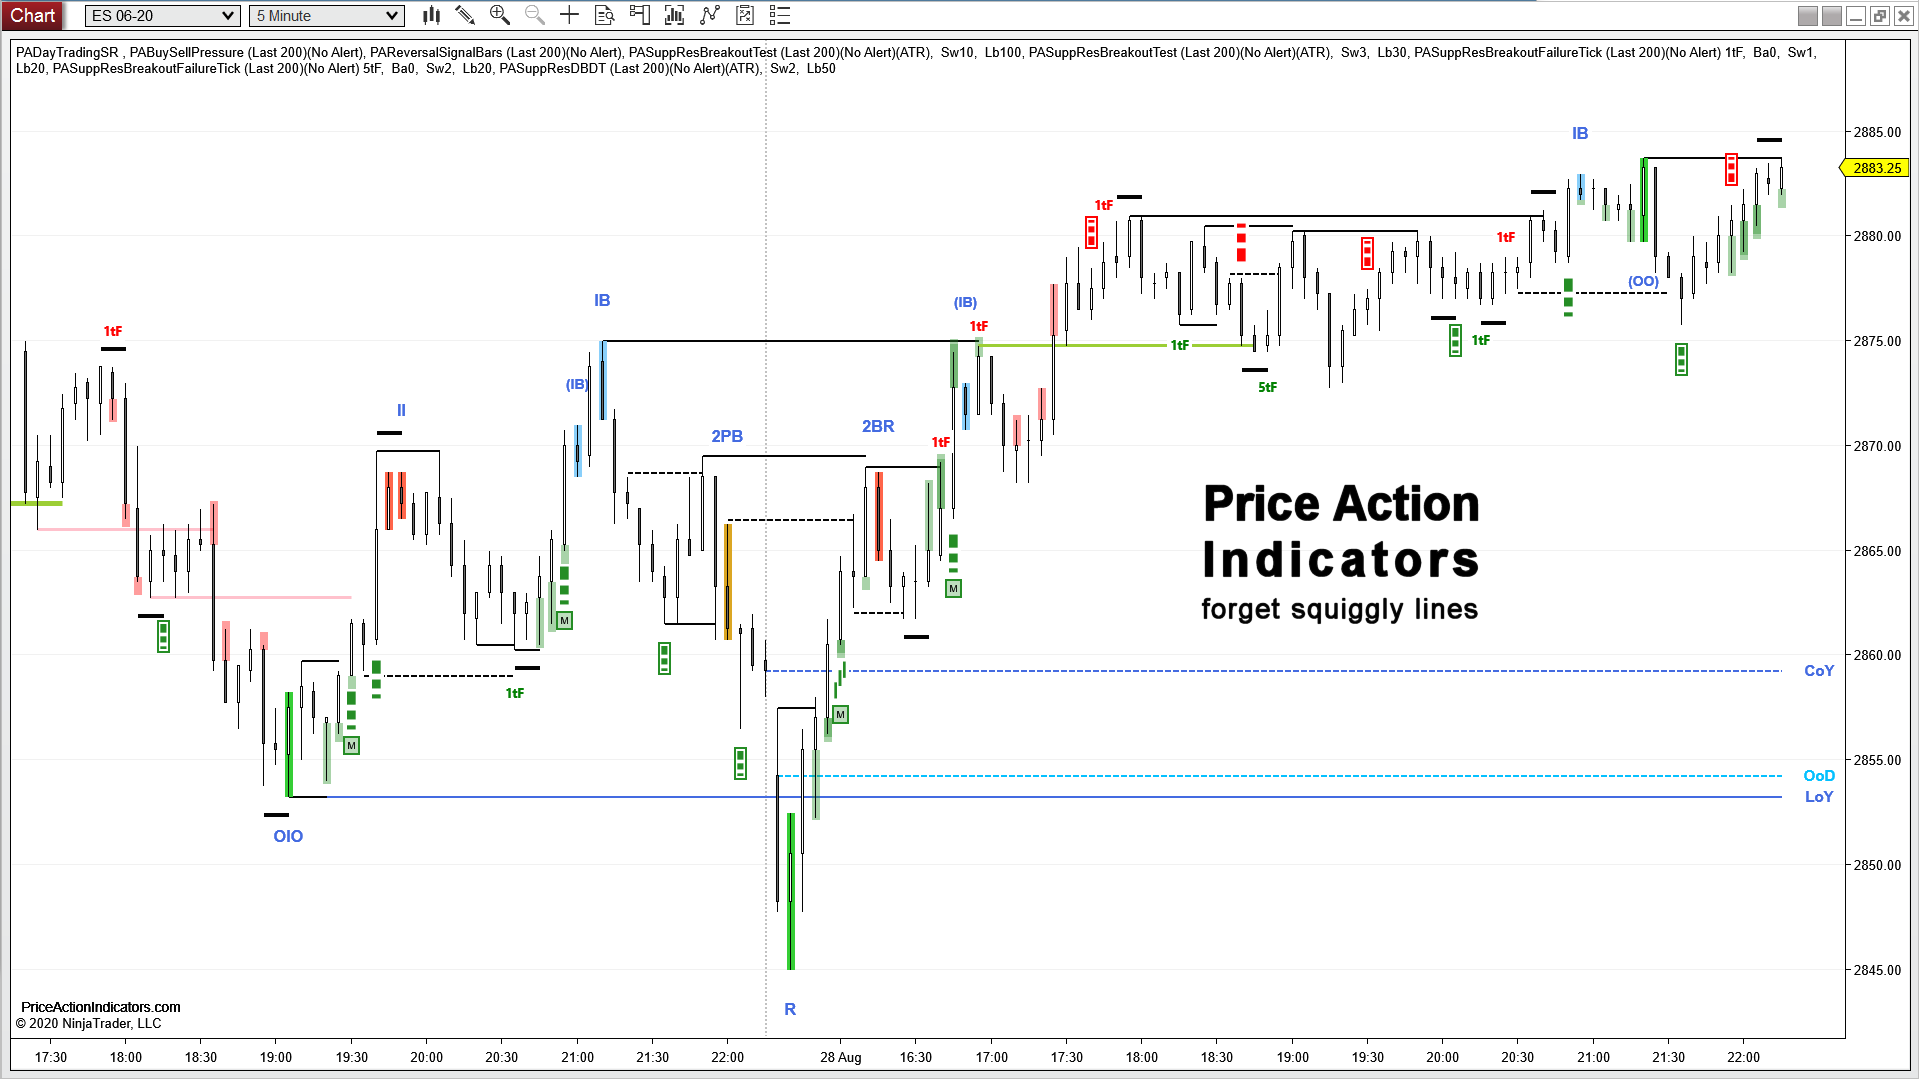
Here is the “naked” version of today’s chart, with just the indicators applied.
one can see nicely, how the HOD tested that major low from yesterday for a Breakout Tests


