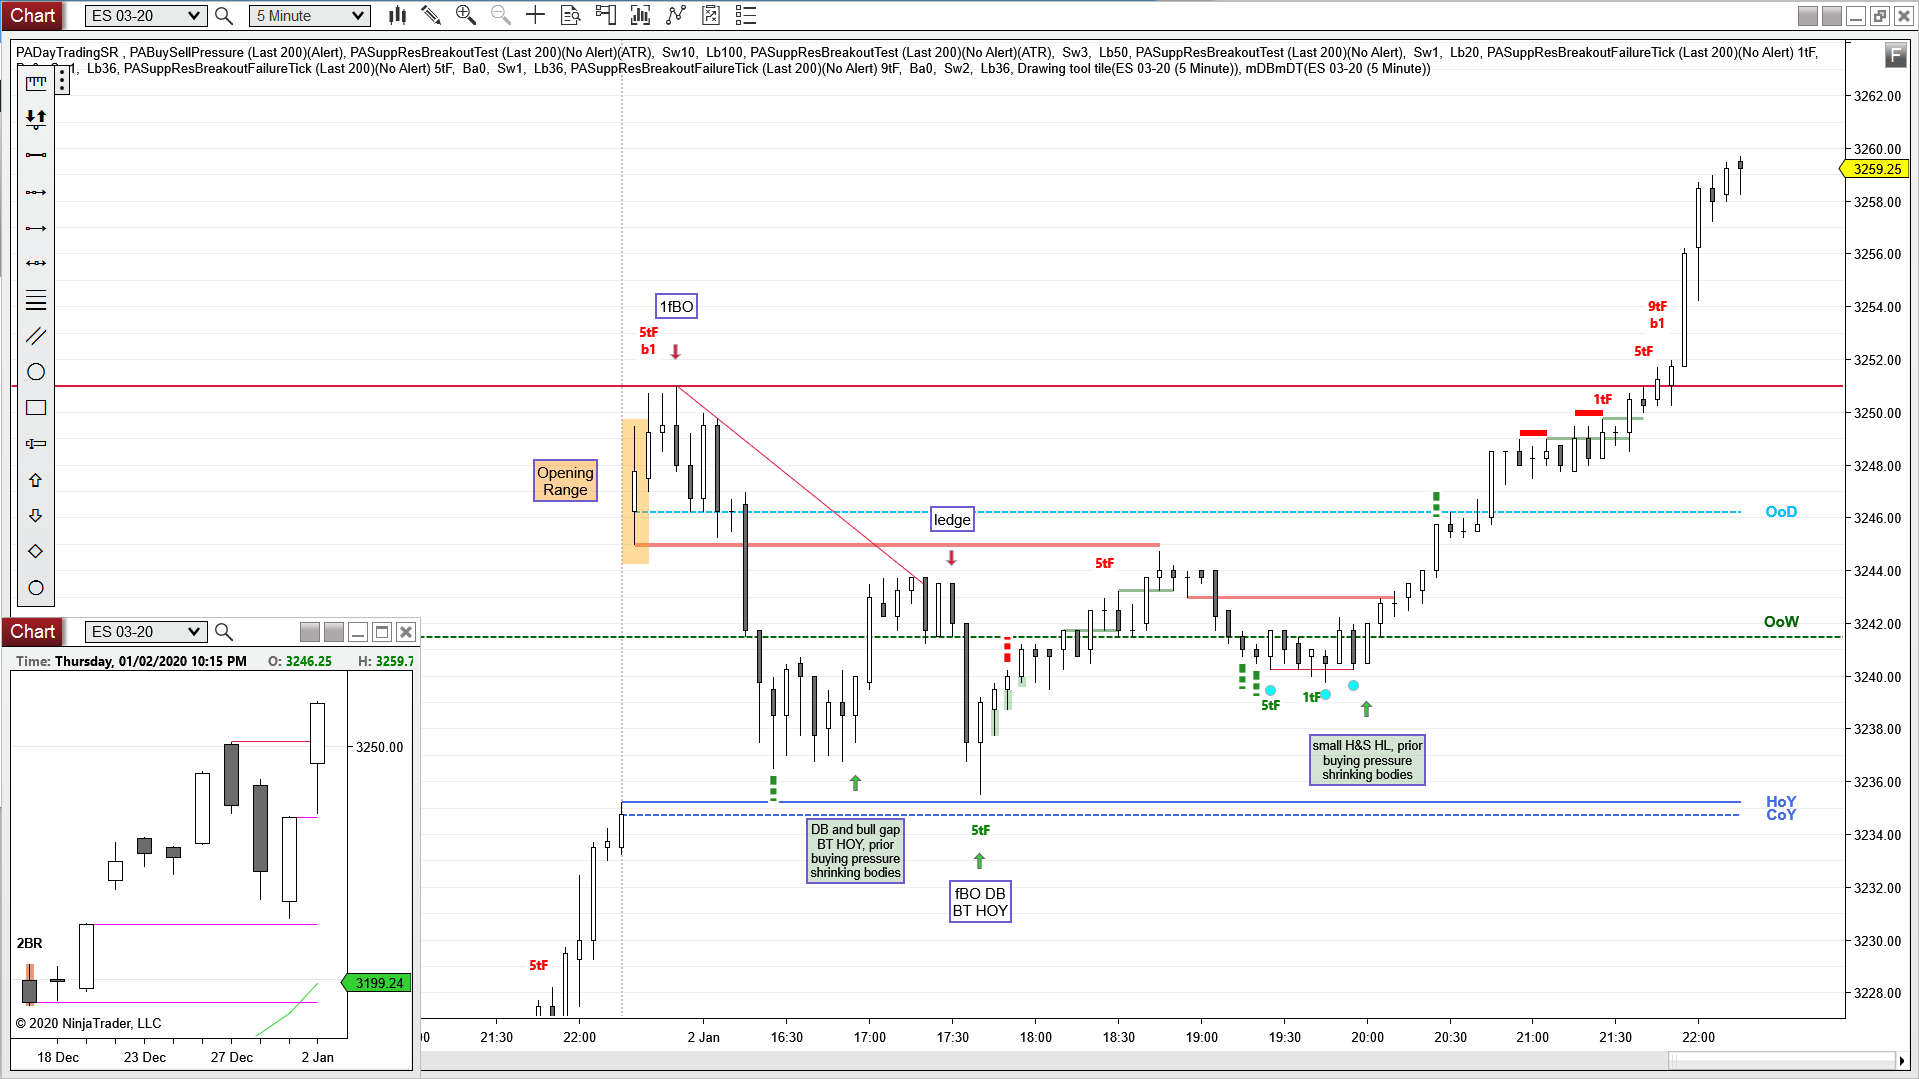
Bull gap, above HOY, Opening Range, 1fBO, mDB, 2fBO, mDT, H2, BT, 1tF BT, H2, HH MTR, fH2
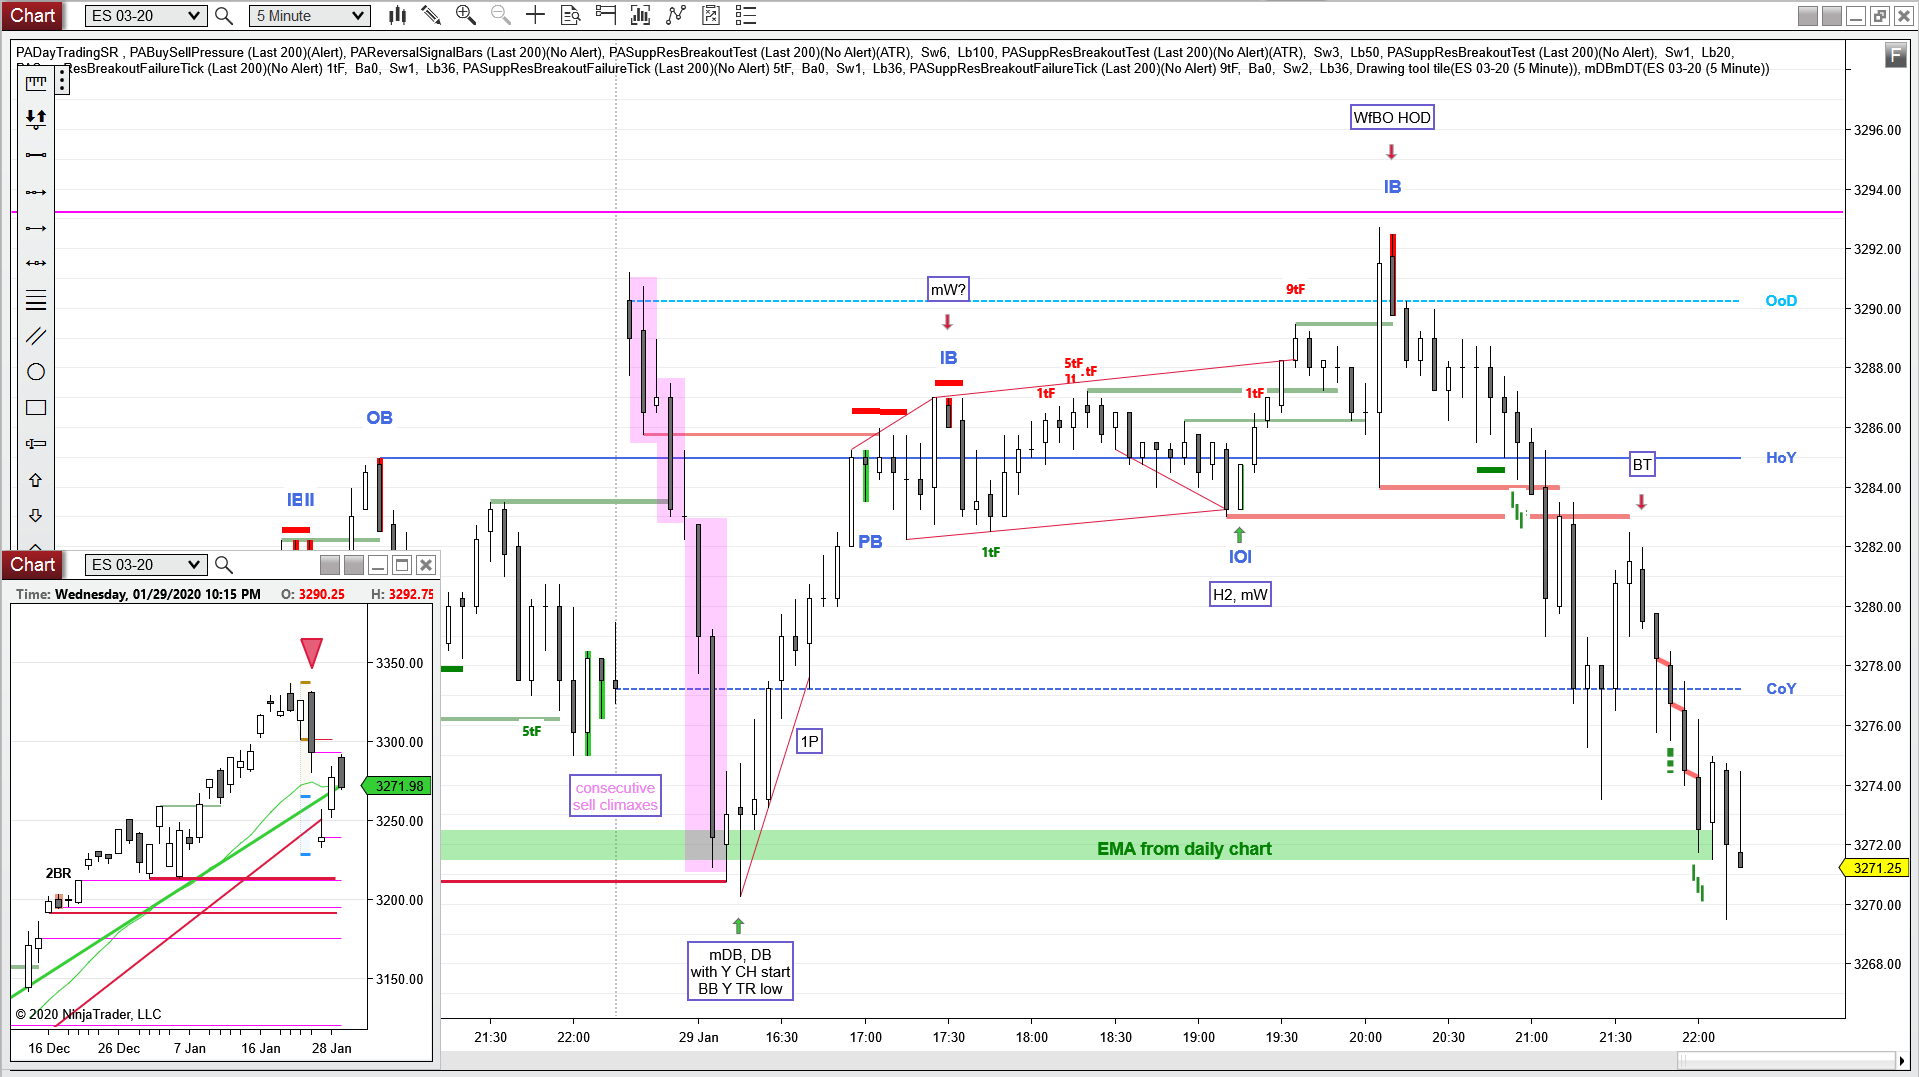
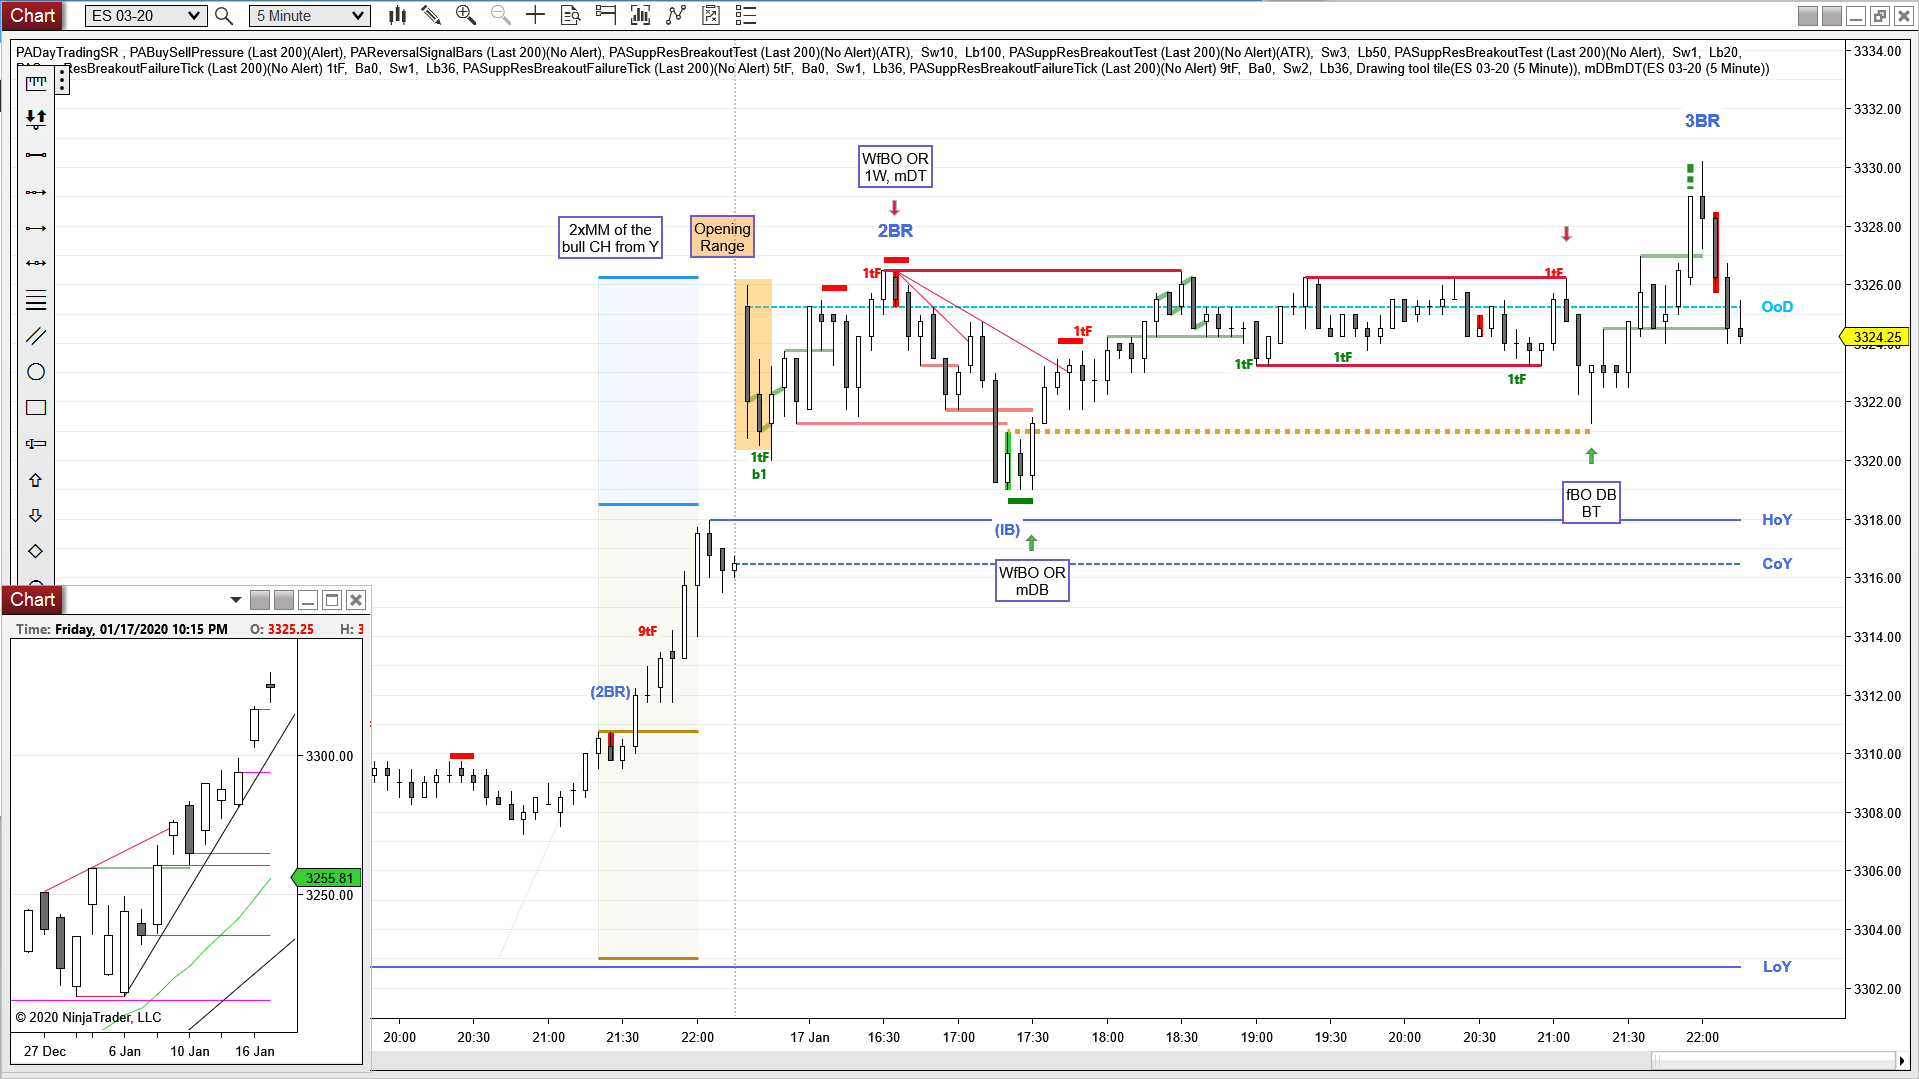
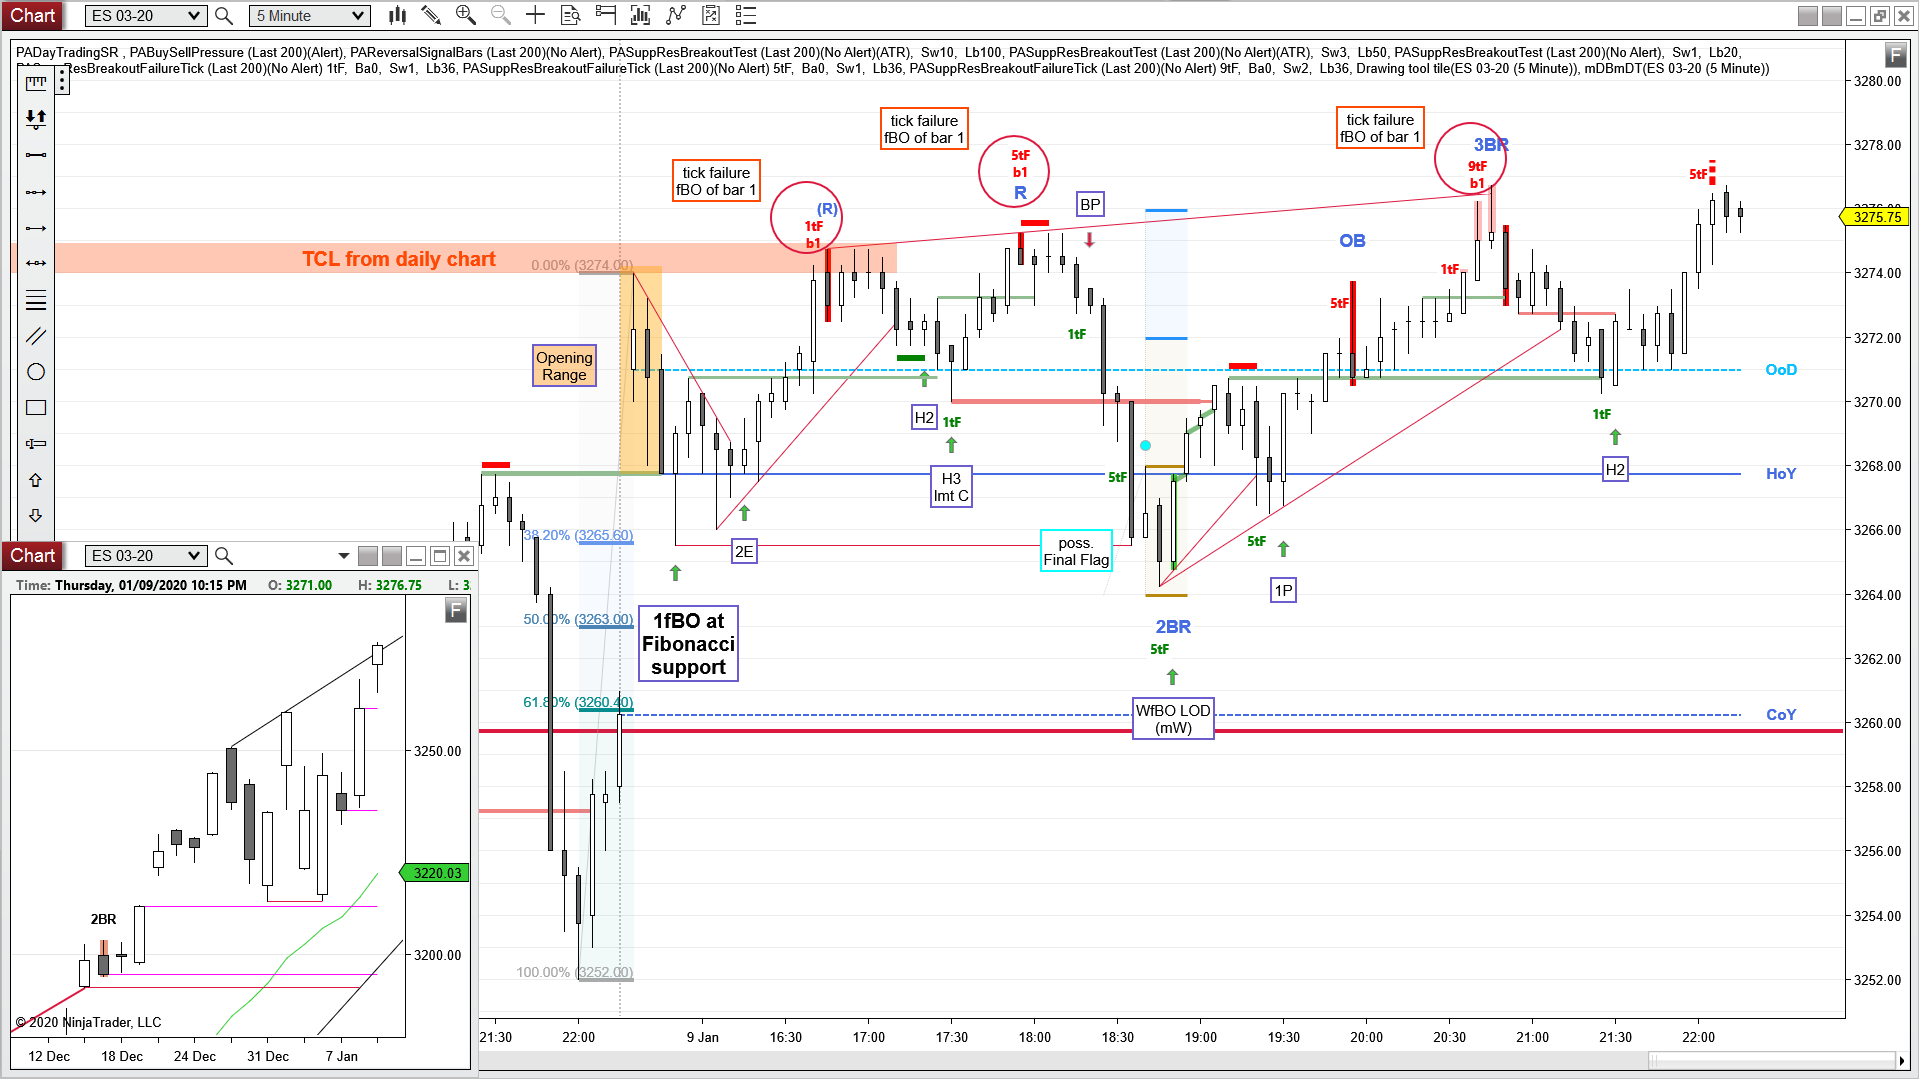
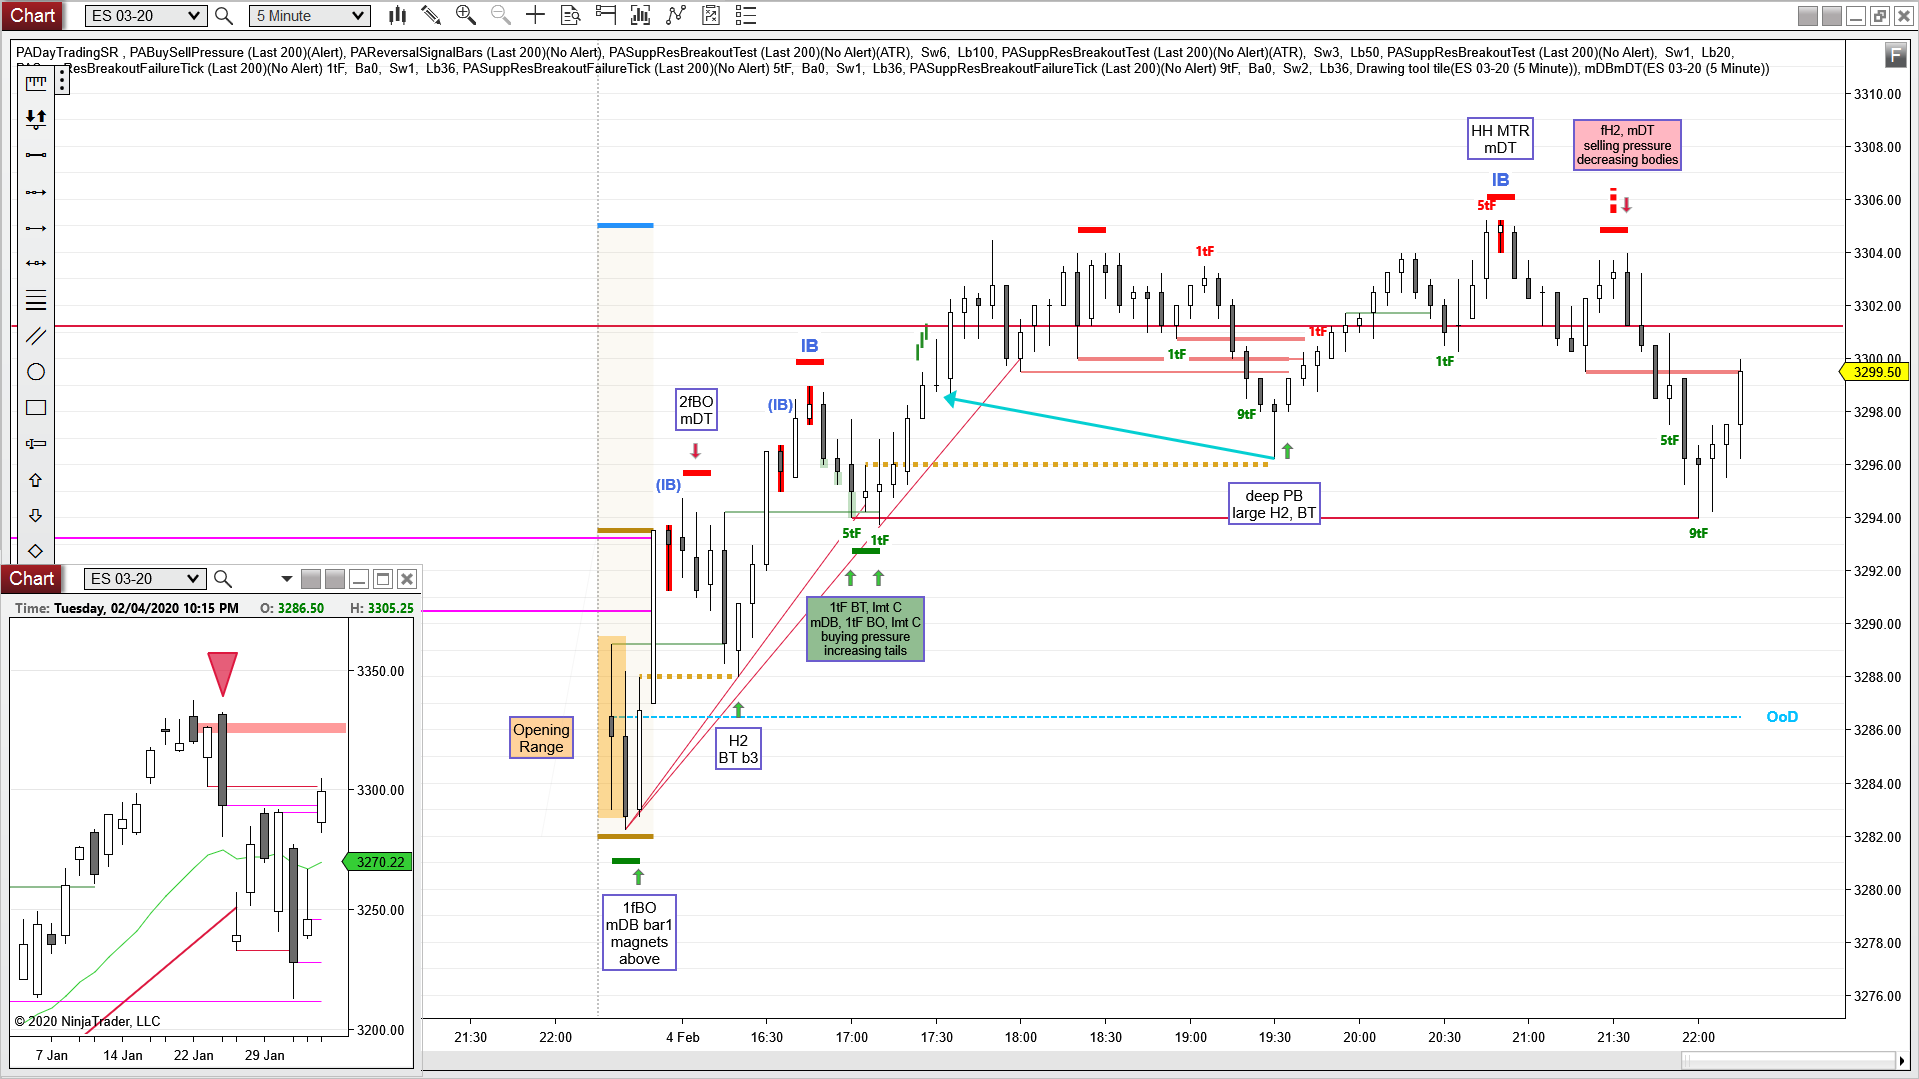
E-mini S&P 500 Future 5 min chart (trend lines, arrows and boxed text drawn by hand)
daily chart
Always In Long (AIL) since today
BO above last weeks high